
- Software
- Price
- Resources
Our Resources
- Free Trial
- Login

As a Technical Strategist who worked for major name Wall Street firms and a multi-billion dollar investment fund during my eleven year Investment Banking career, I am EXTREMELY impressed with Optuma. It is an outstanding Gann Technical Analysis program that leaves most of its competitors totally in the dust. The huge variety of cutting-edge charting tools available, the sheer flexibility of the user options for each study, and the attention to detail throughout are absolutely first class.
Dr Asoka Selvarajah
The Gann edition of Optuma not only provides you with everything anyone could need for technical analysis, but it also has a whole host of incredibly powerful techniques, many of which you can’t get anywhere else. With such sophistication and versatility, it takes a little input to get up to speed. But this also means that once you have mastered it, you have one of the most powerful market weapons in the world at your disposal!
Andy Pancholi
I can honestly say, one year in, I have never regretted the purchase. As a charting platform, Optuma has been brilliant, but more importantly I have real tools built by real technicians. I can’t tell you how invaluable it has been to my development to have many of Gann’s methods available at the click of a button. Real-time reinforcement with legitimate Gann tools has greatly accelerated the learning process for me as I am sure it will for you.
Scott H


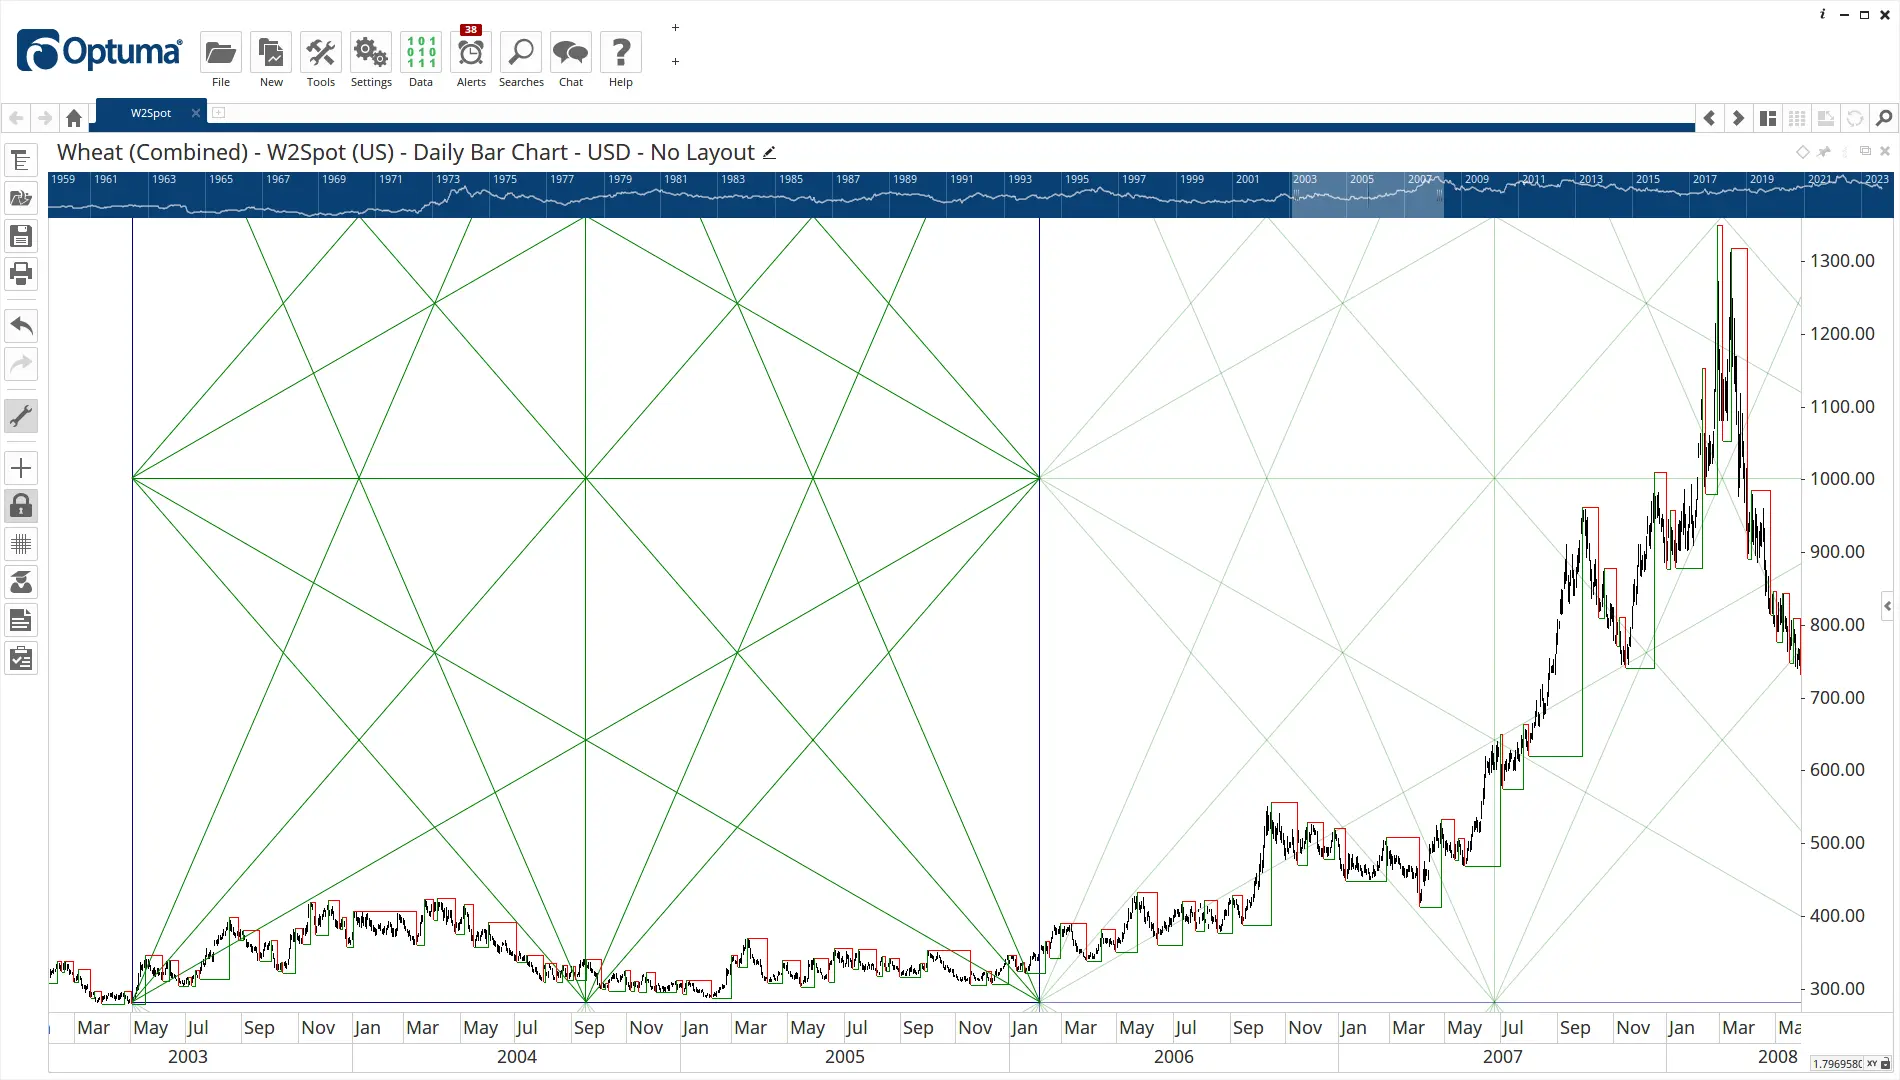
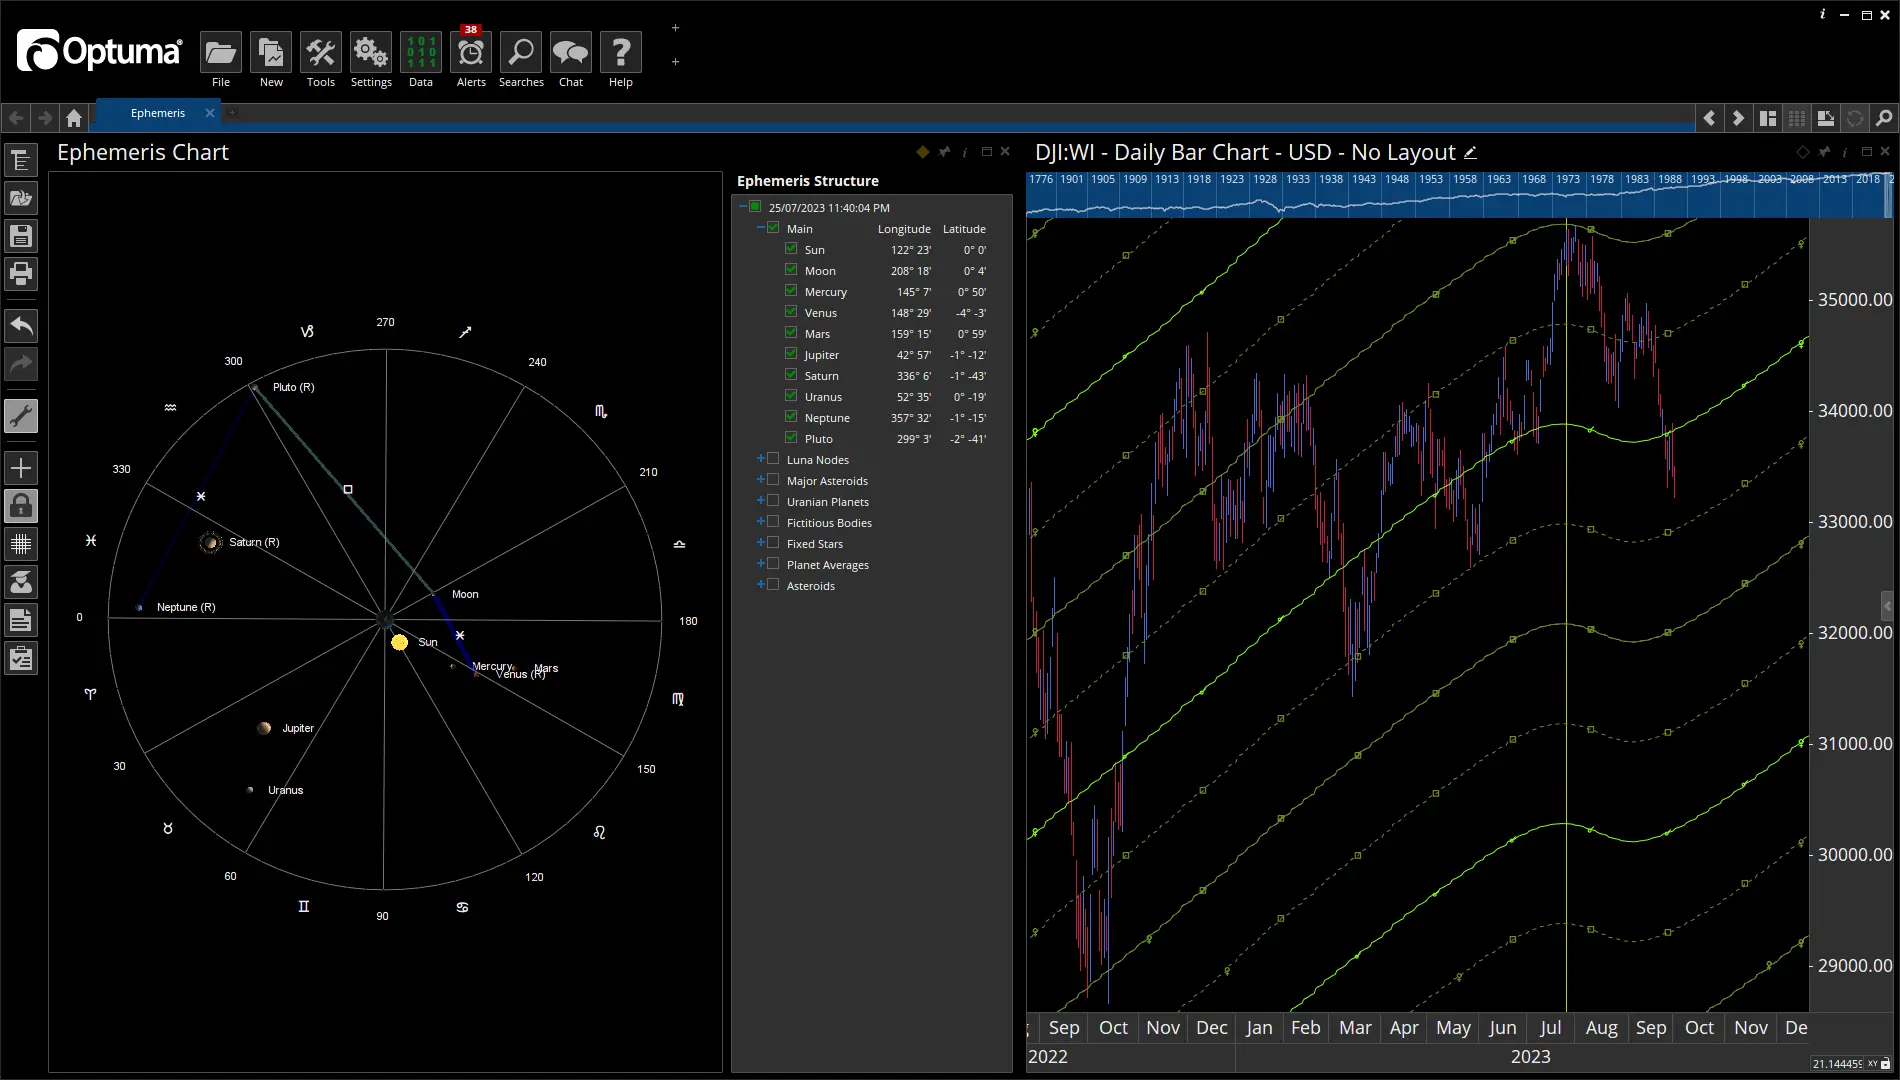
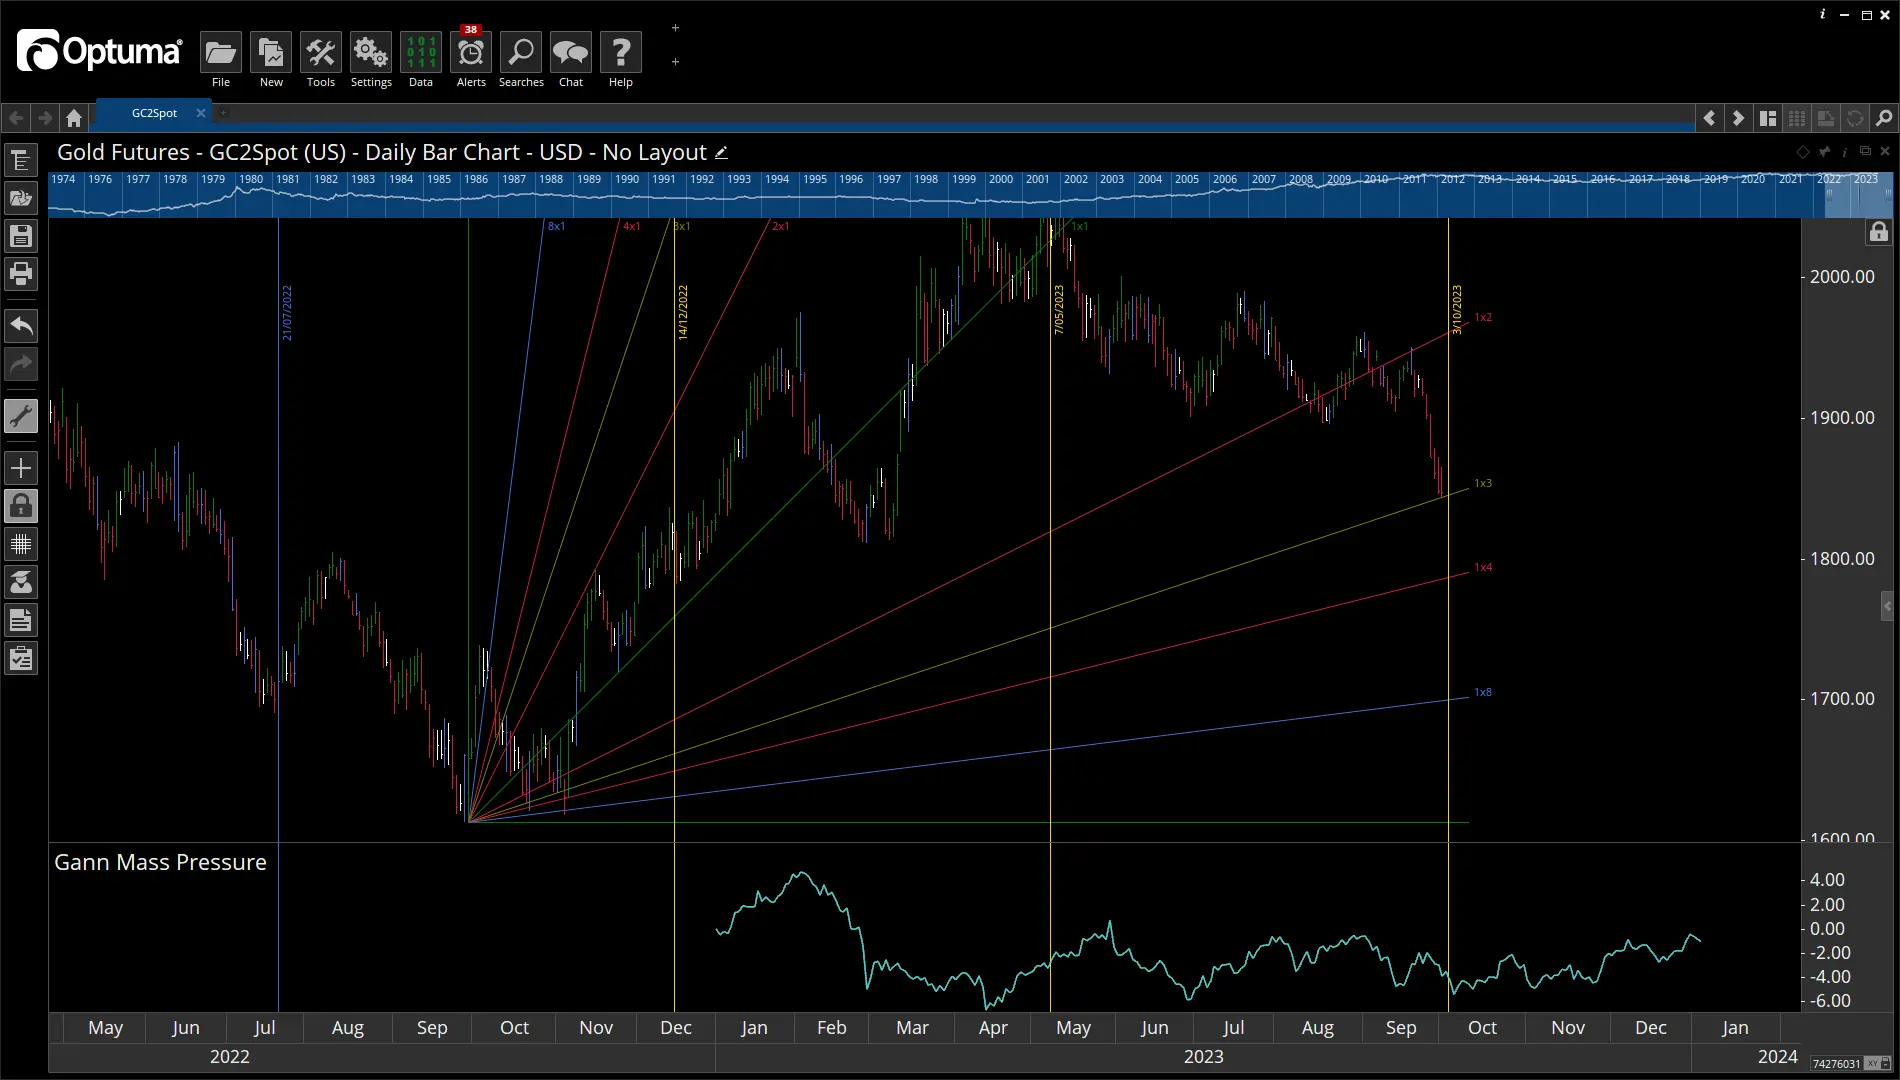
Optuma has led the way with a remarkable platform for traders to assemble and interpret these fabulous tools. Whenever I see a Gann fan angle or a Planetary angle creating support and resistance in our modern volatile markets it is an exceptional opportunity. We can correctly measure the value of these tools in Optuma in literally seconds. The original masters would have had to take weeks or even months to replicate these signals and calculations.
Alan Oliver Author & Educator, Trading Prophets