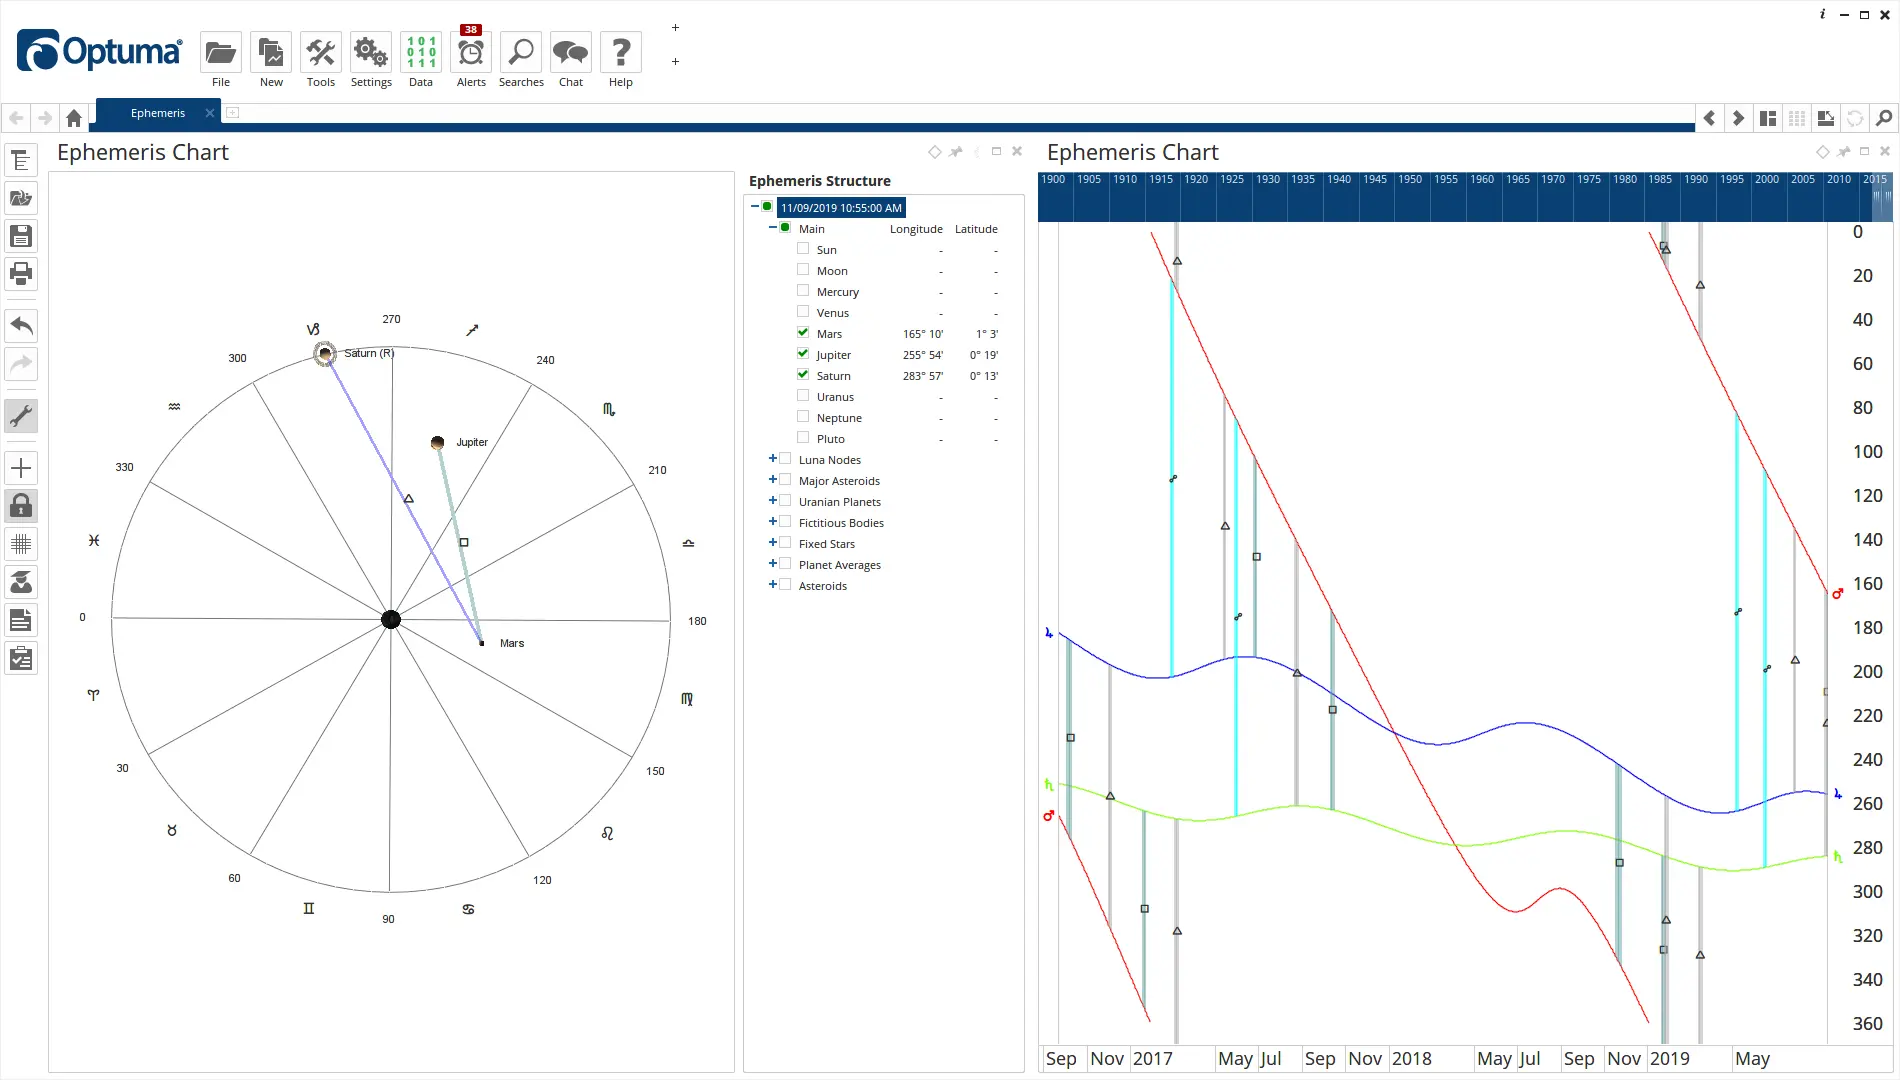
Ephemeris Charts are used to display the positions of celestial bodies (planets, asteroids, and other astronomical points) at specific dates and times. These charts provide crucial data for astrologers and astronomers to track the movement of celestial bodies throughout time. Historically these were handwritten tables of values, and then 2D images showing longitude. In GannTrader we are able to create 3D charts so you can see the actual position of the celestial bodies you are tracking in both longitude and declination.
An Ephemeris Chart allows you to see the bigger picture of planetary relationships. The relationship is not simply a static number but a dynamic & fluid orchestration between the planets. The nuances of these complex relationships help us as we study the correlations between planetary events and market reactions.
Statistically, the correlation between aspects and changes in trend is visible but not very high. Often the events studied happen only once every 100 years and we lack sufficient data to make a sound conclusion.
To use an Ephemeris Chart all you need to know are the planets or celestial bodies you want to observe and the time you want to view them. The next step varies on what you want to do and where you are using your ephemeris chart. In GannTrader, we do a lot of the work for you so you can quickly measure the angles between celestial bodies, view astrological signs, and search for specific setups.
GannTraders Astrology software brings you a fully customisable and user-defined Ephemeris Chart that instantly displays any number of planets, asteroids, node positions, and other planetary positions. This allows you to easily identify key planetary relationships.
There are four types of Ephemeris Charts in GannTrader:
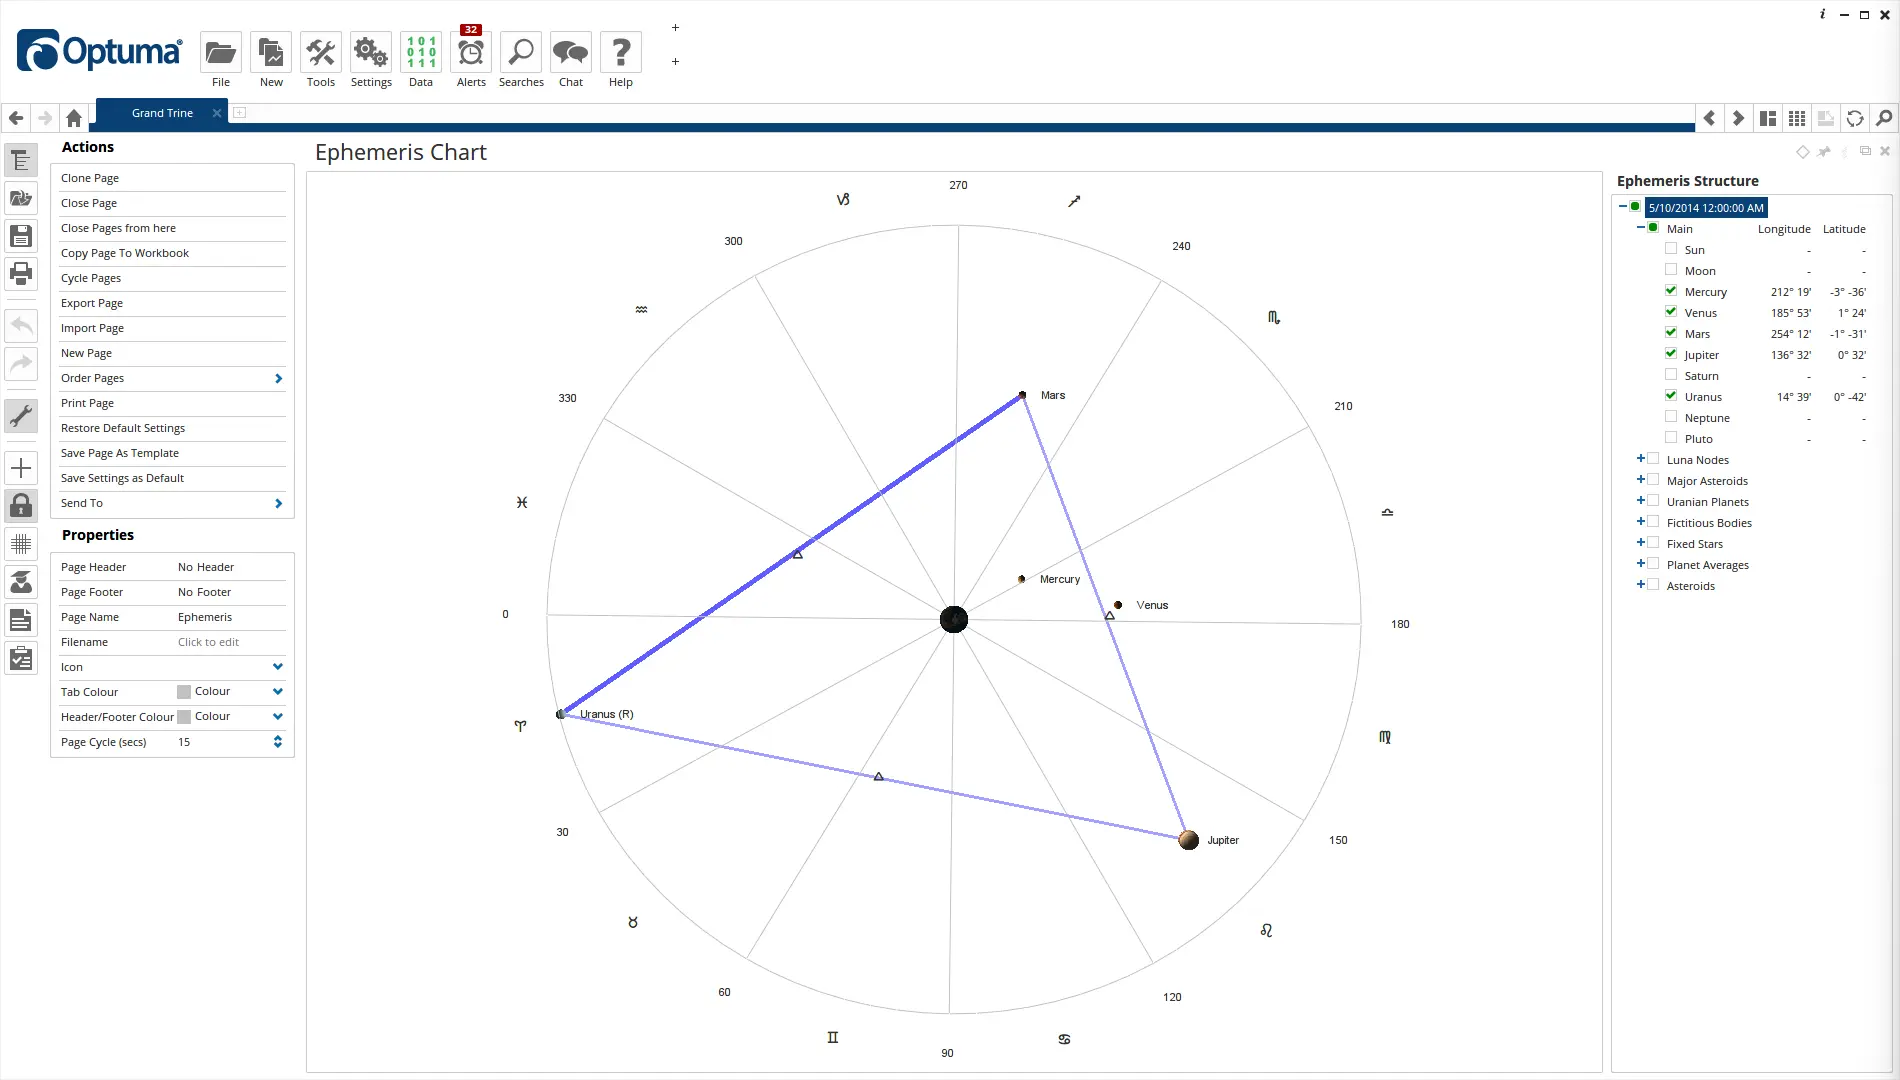
The Ephemeris is the visualisation of the position of the planets in the solar system at any date showing the defined aspects (e.g. conjunct, opposition, square) between them.
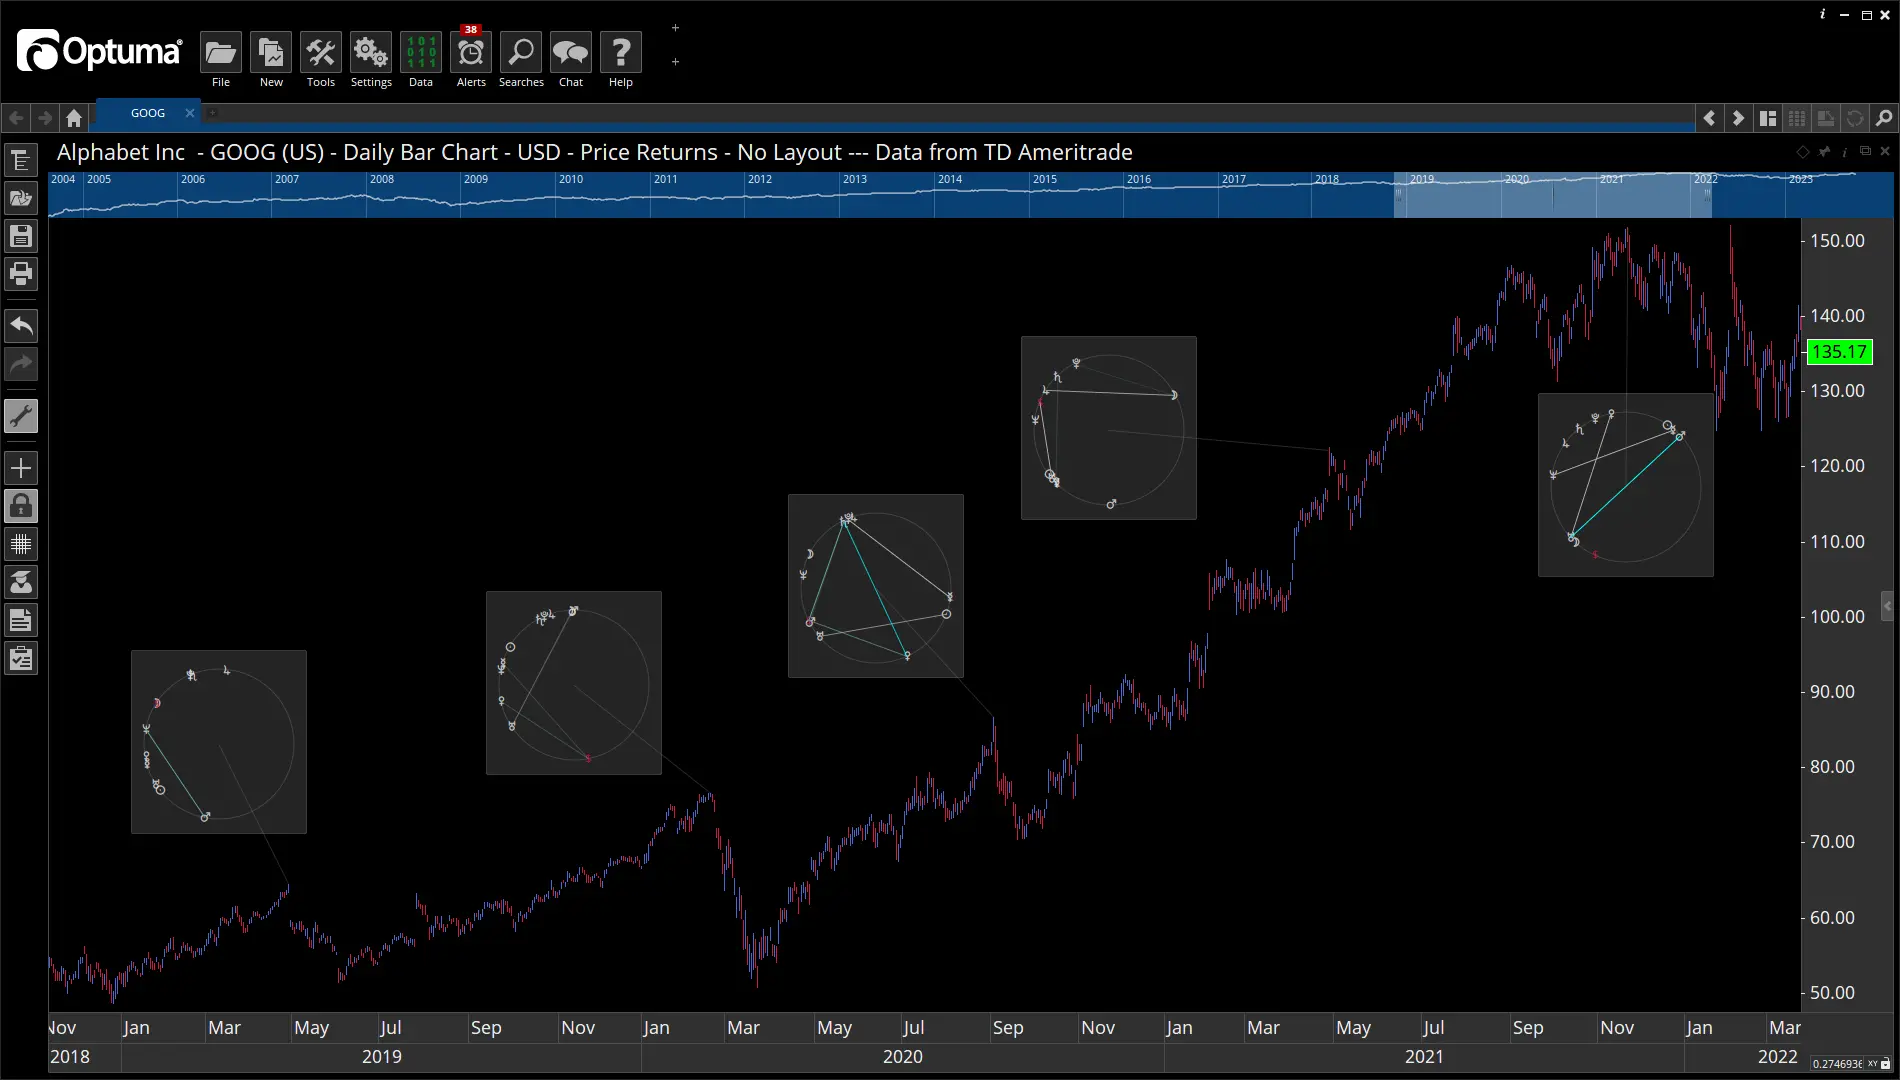
A second version is the Ephemeris Chart tool which can be placed on a normal Price Chart. With this tool you can place mini Ephemeris charts at major points on your charts and see planetary positions and any aspects.
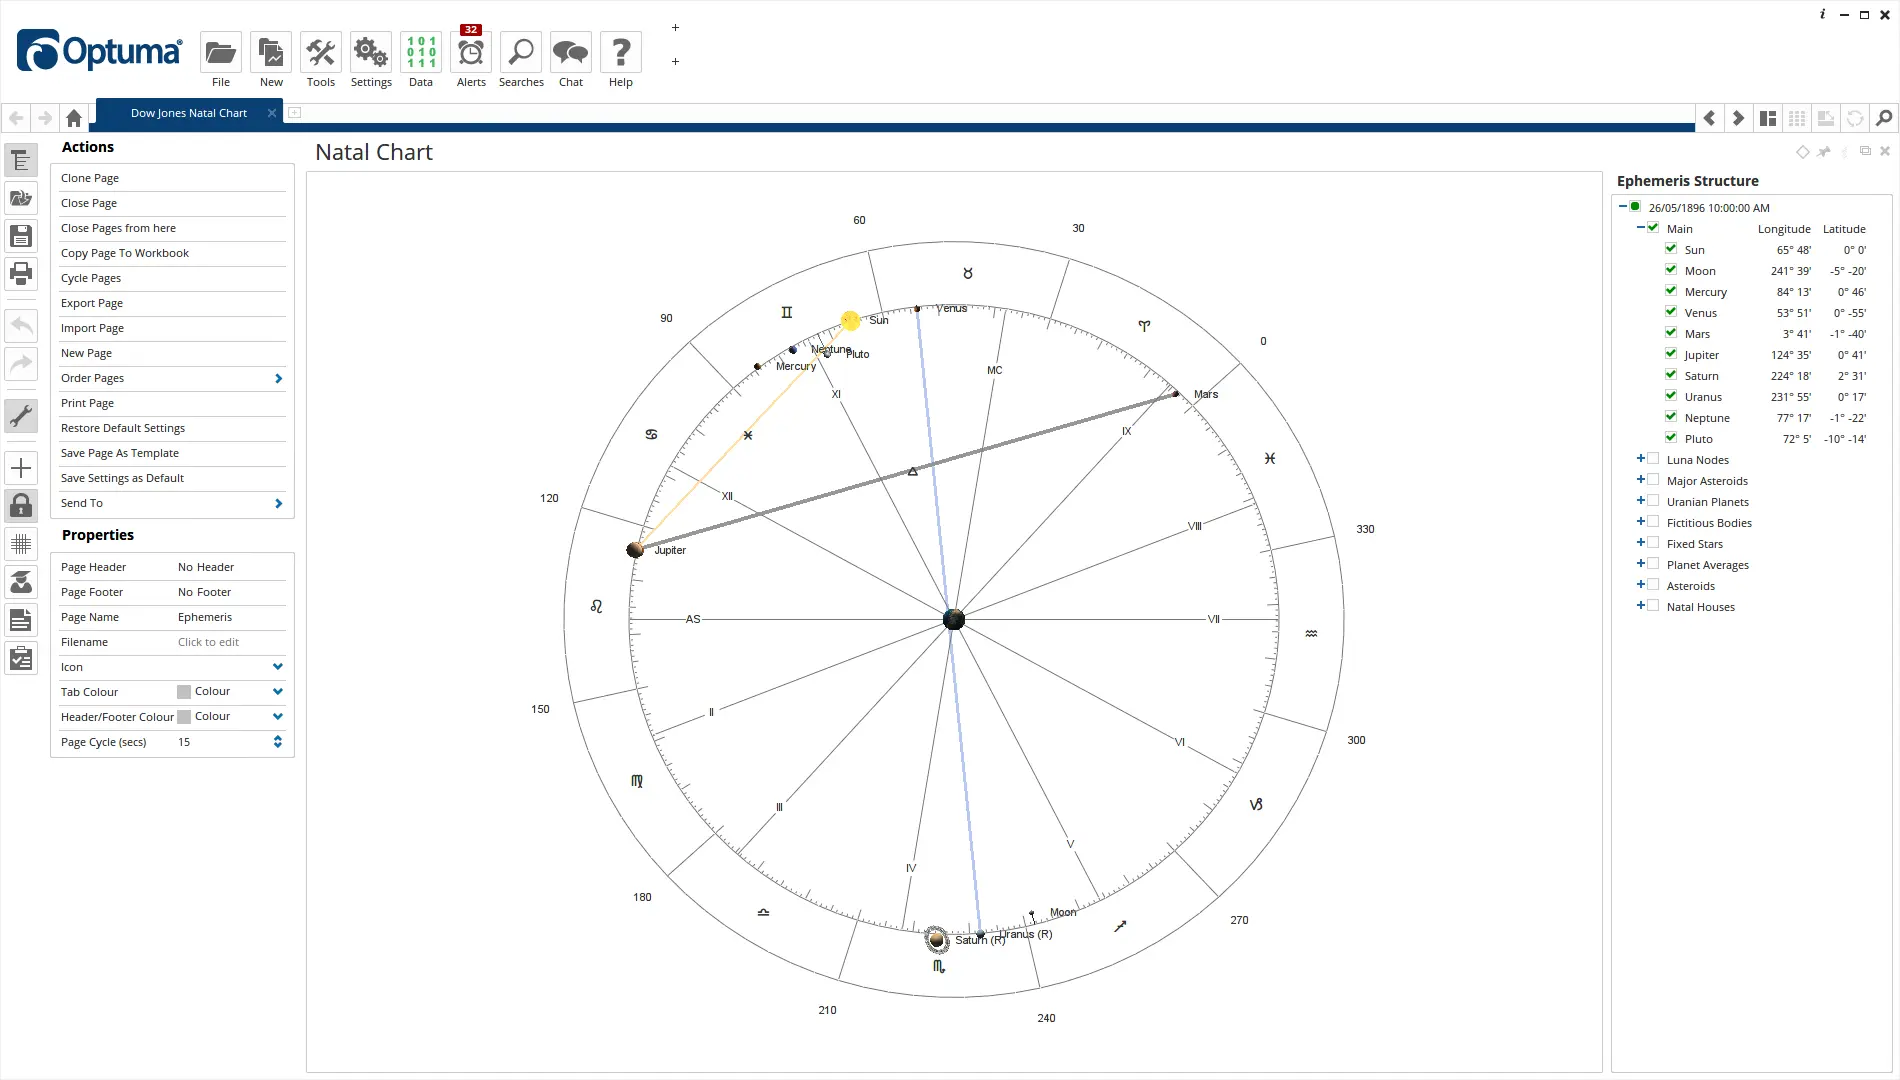
The Natal Chart is similar to the Ephemeris Chart but adds house information including the ascendent, descendent, midheaven, and all the other 9 houses. For the Natal Chart to be accurate, topocentric coordinates need to be entered.
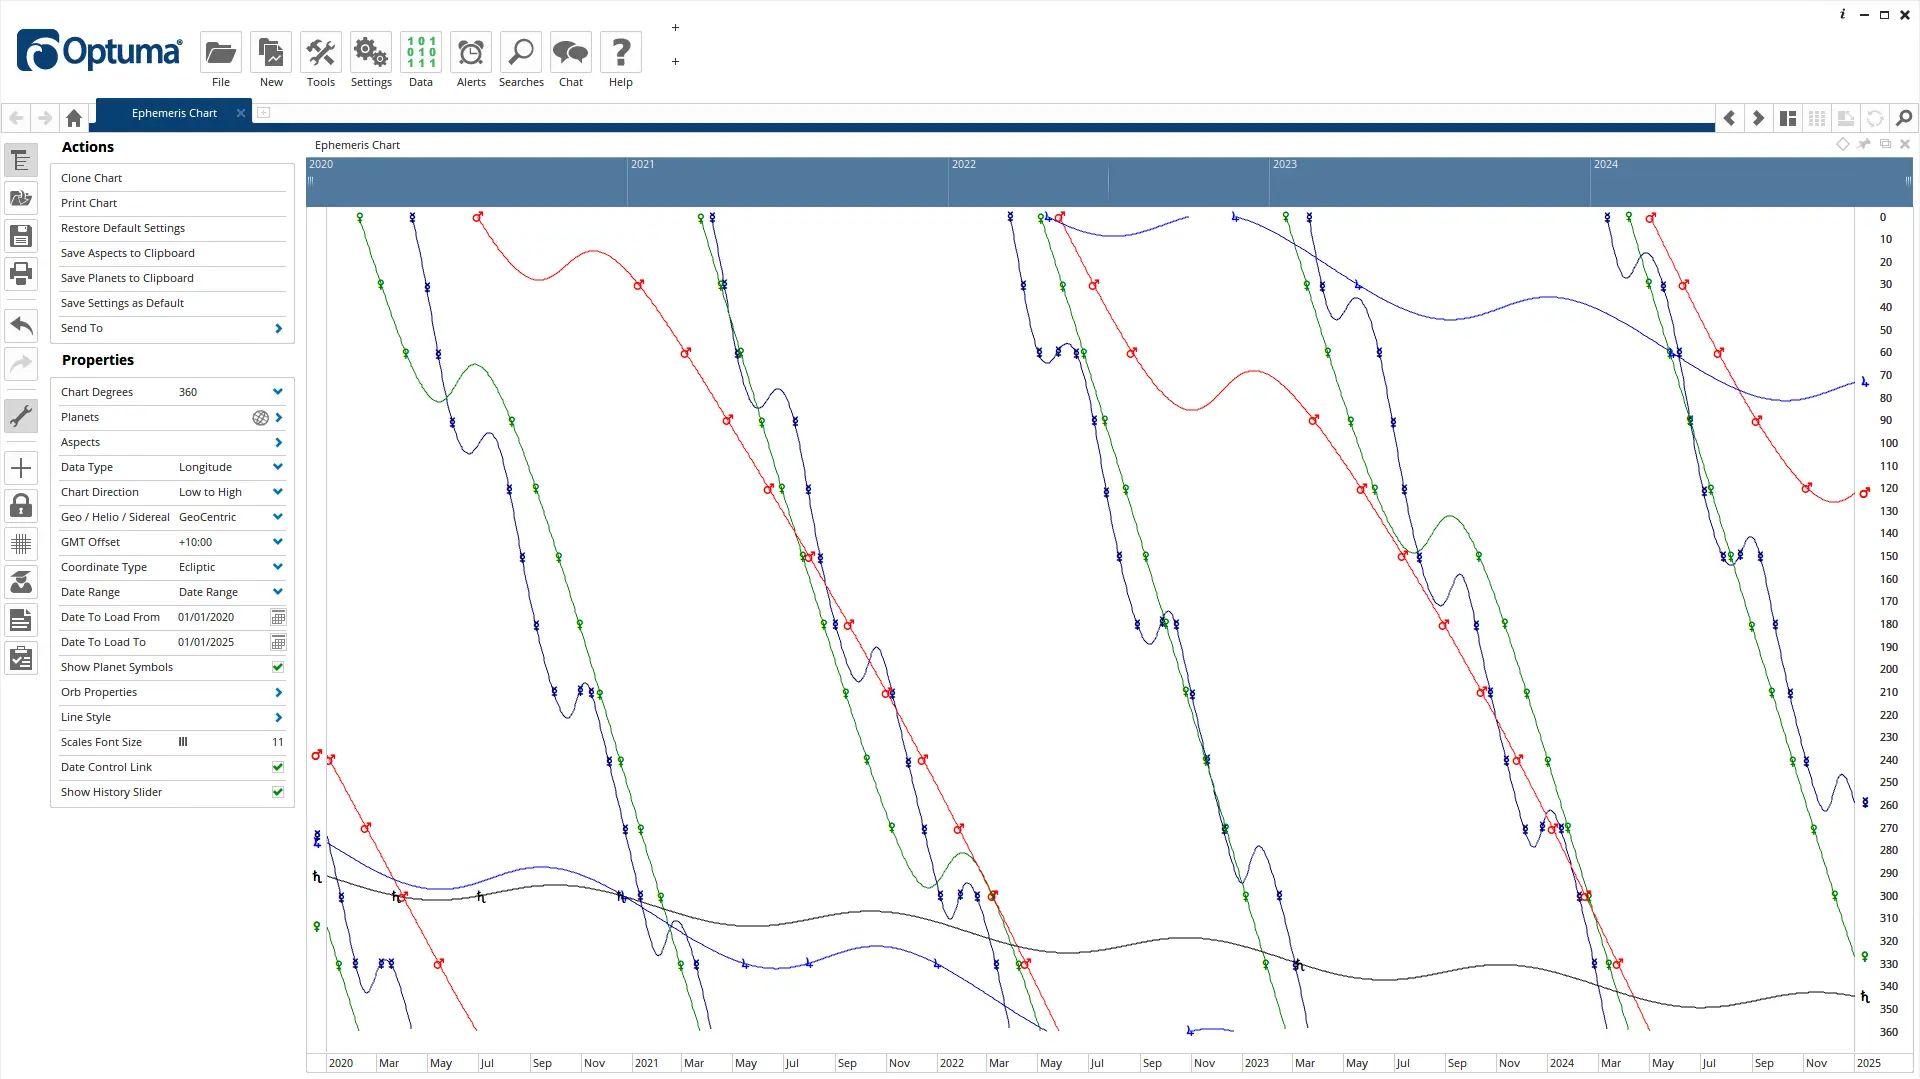
A fourth version displays the longitudinal values of the planets between given dates. This example shows opposition aspects between 2020 and 2025.
No, Ephemeris Charts and tools are only available in the GannTrader and Gann Decennial packages.
Yes, GannTrader has a tool that places a small Ephermeris directly on a chart. You can read more about it in our knowledge base.
View the markets with a clear lens
Sign-up for your free trial to GannTrader
Copyright 2025 © Optuma Pty Ltd
Level 6, 200 Adelaide St, BRISBANE QLD 4000, AUSTRALIA
ABN 41 628 890 095