Experience two decades of Gann-based analysis expertise with GannTrader. As we are committed to constant development, you are provided with the most advanced Gann software available. GannTrader’s powerful tools and modern graphics deliver precise insights for decisive 21st-century decision-making.
GannTrader gives you:
The most powerful Gann and Gann-inspired indicators available
Advanced graphics so you can clearly visualise data
Accurate and advanced tools you can’t find anywhere else
Flexibility and personalisation for you to build a platform you’re comfortable with
New indicators rooted in original Gann theory with innovative enhancements.
Why GannTrader is the only True Gann Software
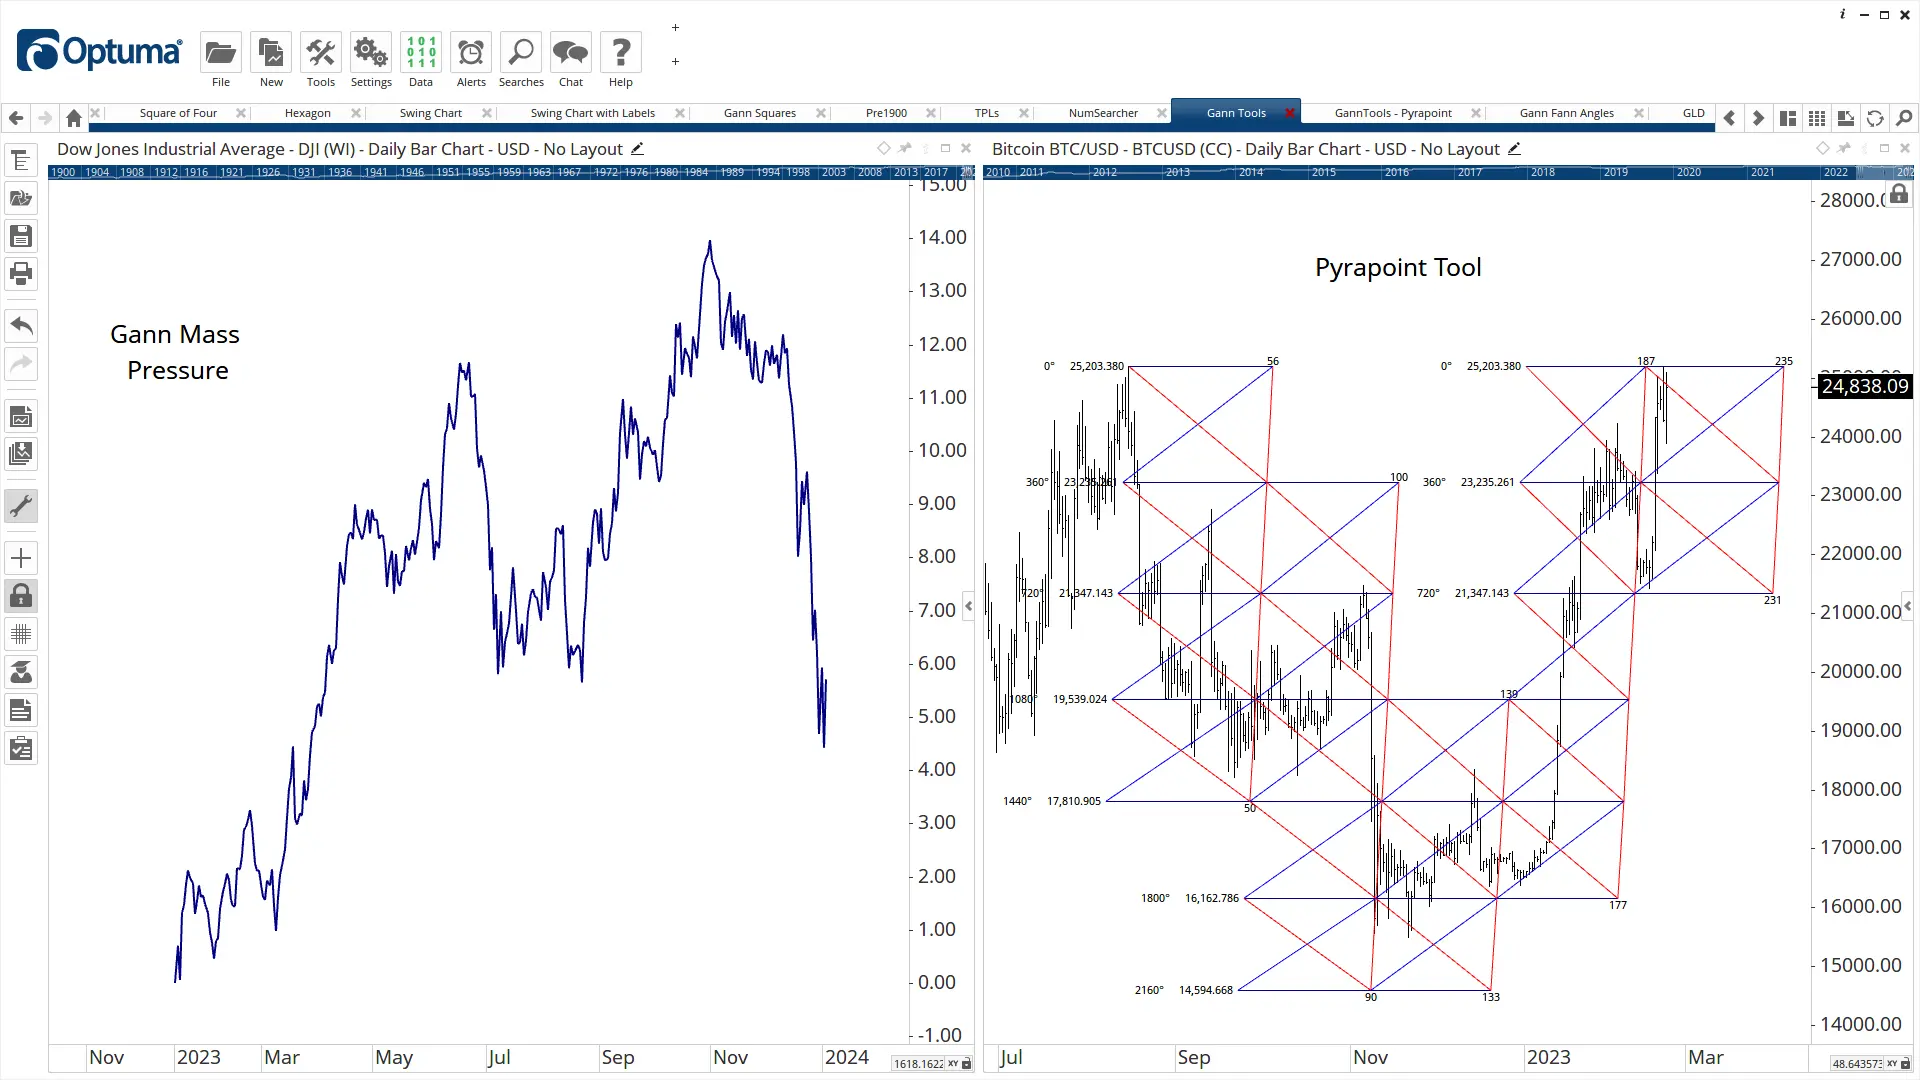
Most of Gann’s charting work was on fixed graph paper with locked scales. In that environment, a 45° line (the building block for nearly all of Gann’s methods) was easy to draw and was consistent no matter where Gann drew it on the chart. In software, our scales are constantly changing to fill the screen with the data. The tools in GannTrader have been engineered over decades to compensate for this. They use a consistent Price Unit for each security. Every Gann indicator references that unit so you don’t have to do the manual calculations.
Continue reading below for a breakdown of our Gann Analysis features.
“I wanted to repeat many of Gann’s techniques in a charting application so traders like you and me who are not mathematicians could use the advanced trading techniques of Gann. Over the last decade, I’ve met with many of the greatest educators who use Gann techniques in their trading. What I’ve learnt from these experts is invaluable. I’ve applied that knowledge to create an incredibly advanced Gann charting application.”
Mathew Verdouw, CMT, CFTe, Founder & CEO of Optuma
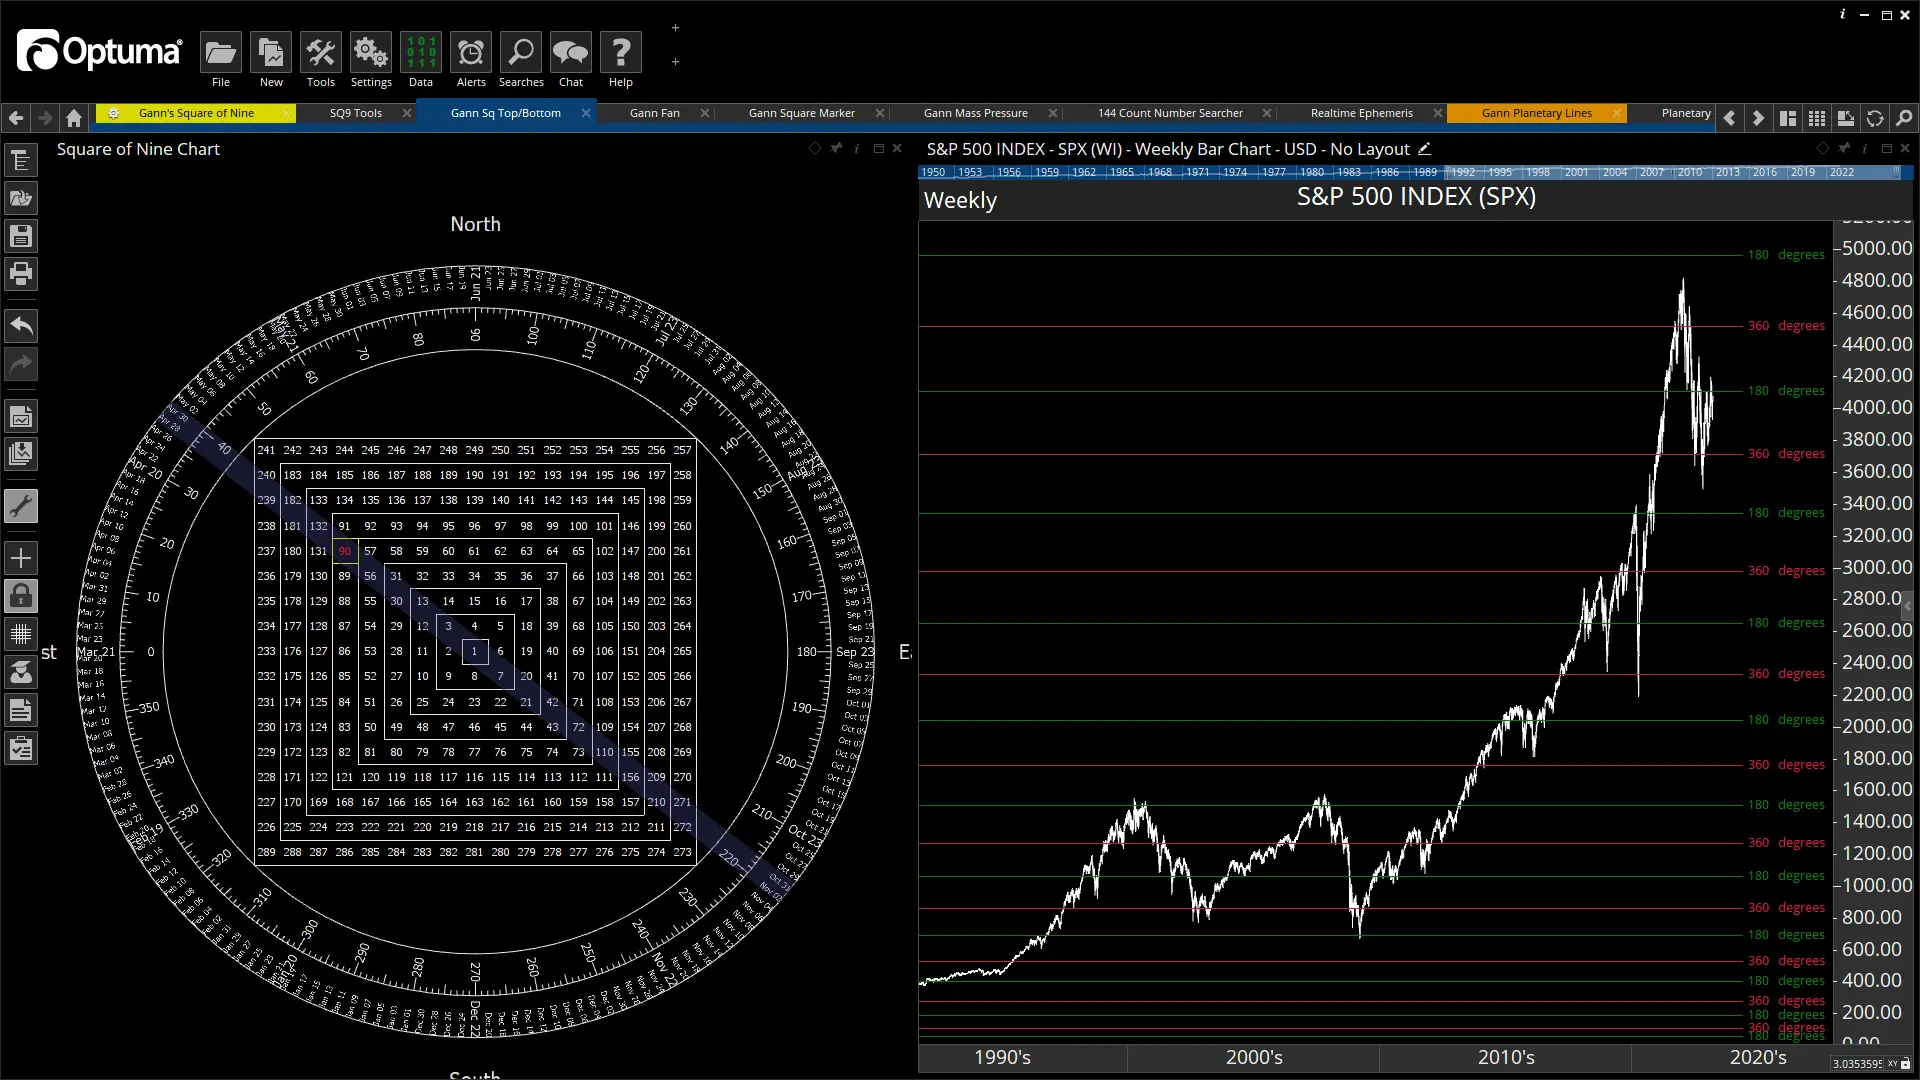
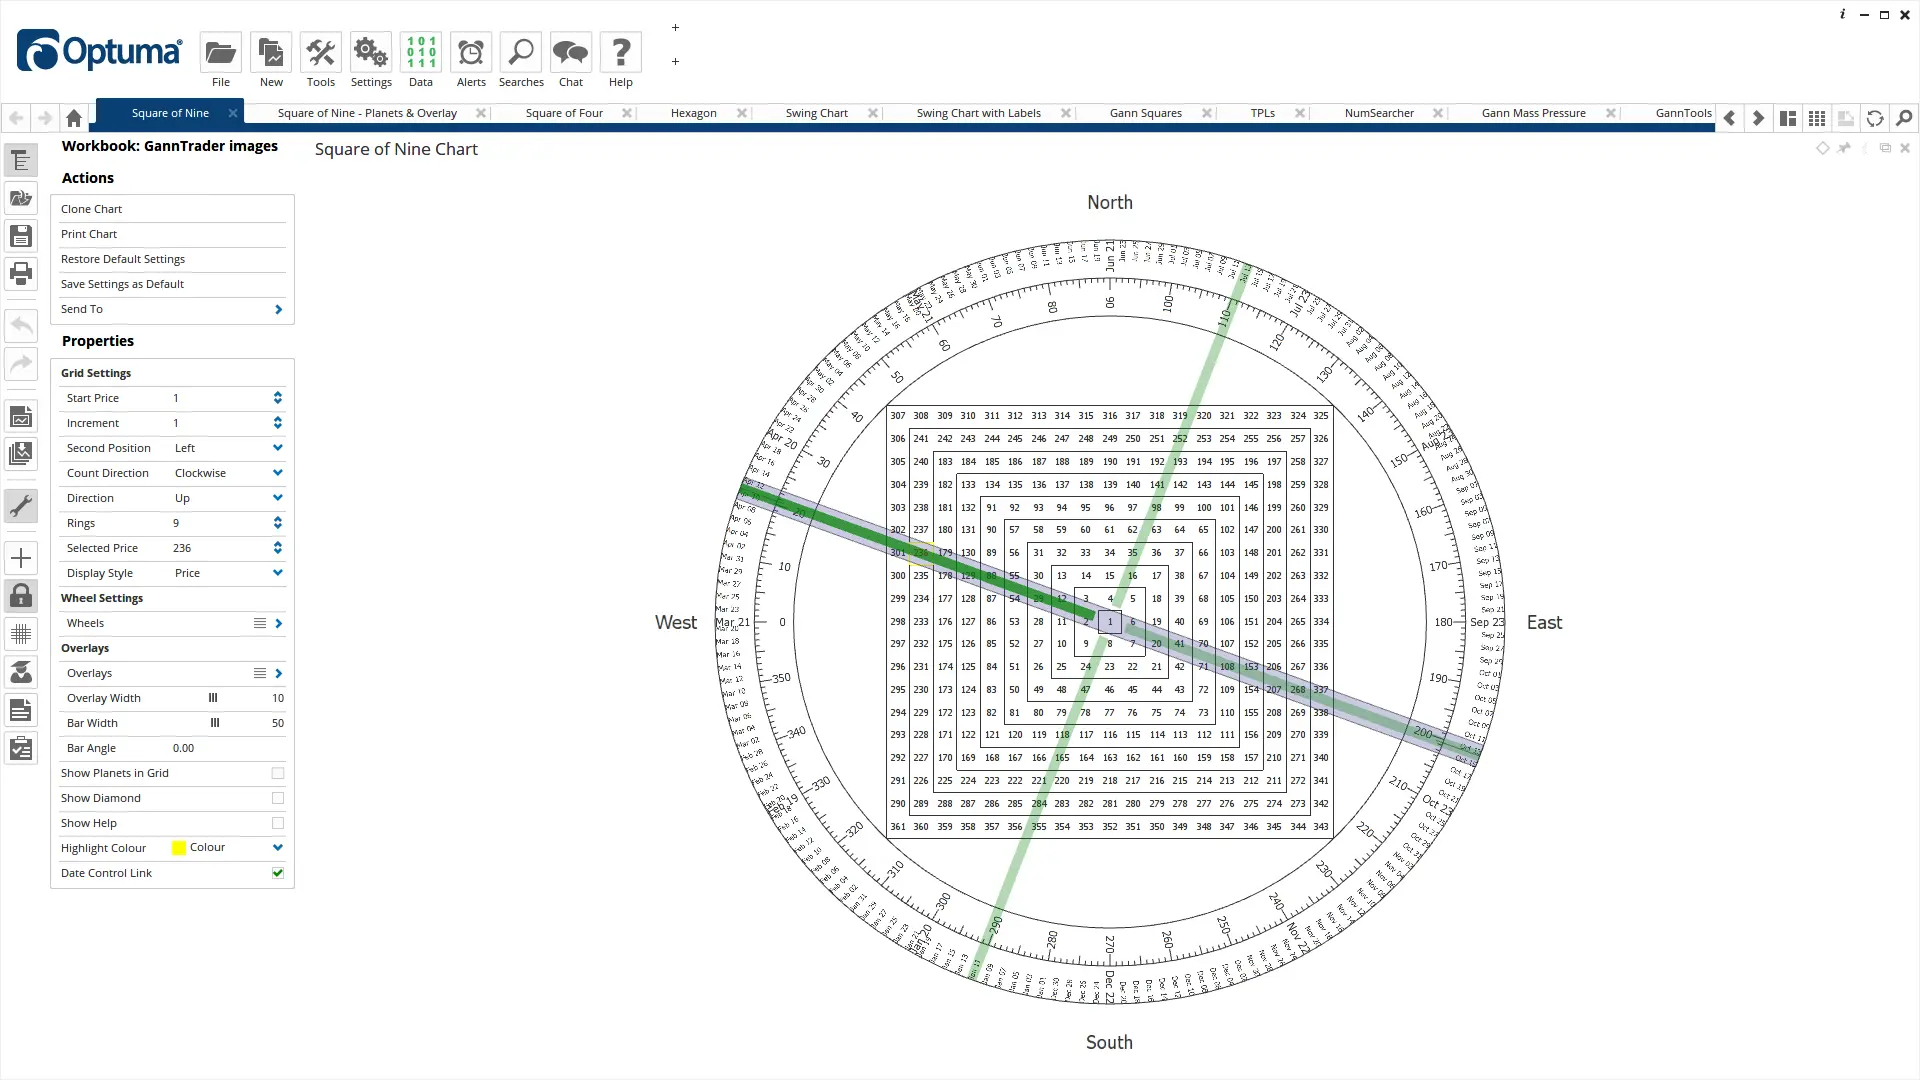
No longer is the old wooden Square of Nine wheel needed. GannTrader includes the world’s first fully customisable and interactive Square of Nine wheel. It offers complete user control for quick and easy time and price target point identification.
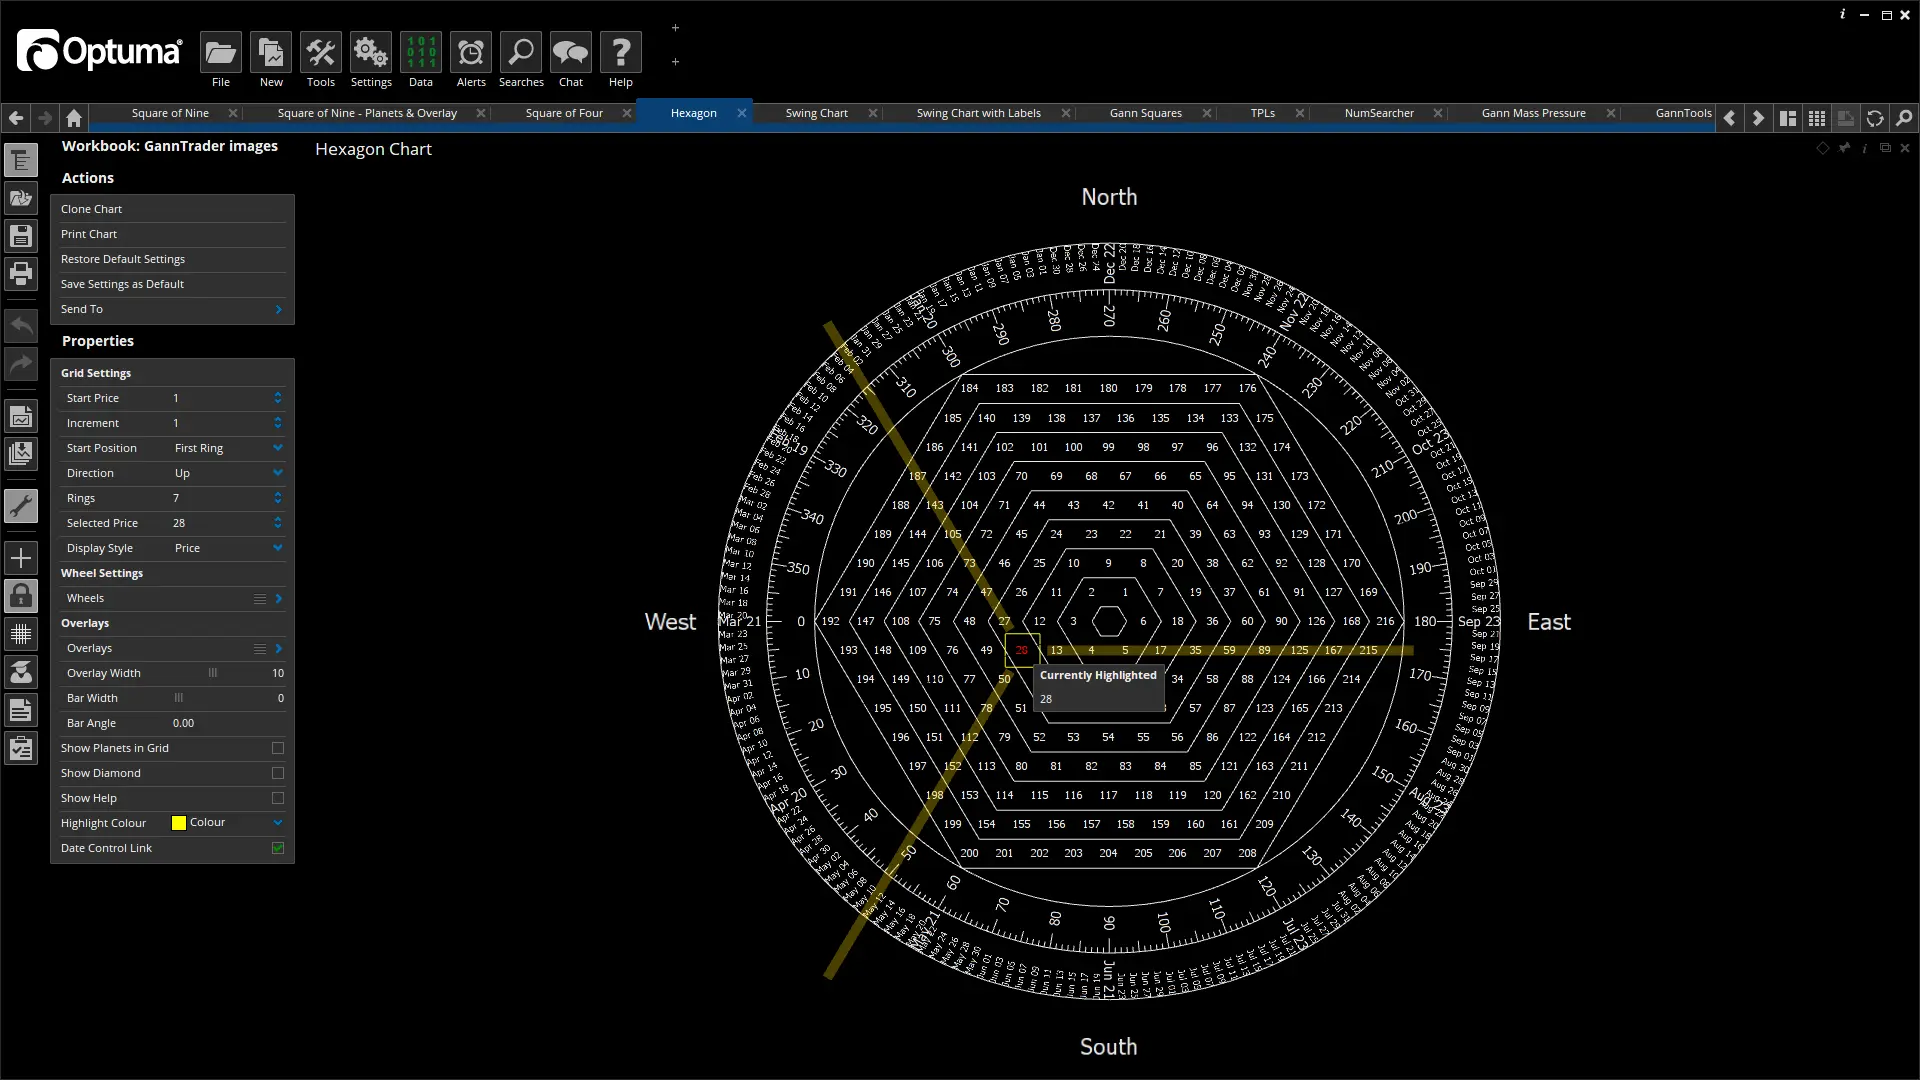
Used extensively by W.D. Gann, the Hexagon chart has been studied and documented in detail by many authorities on the subject of Gann. Now these studies can be easily examined with the power and speed of GannTrader.
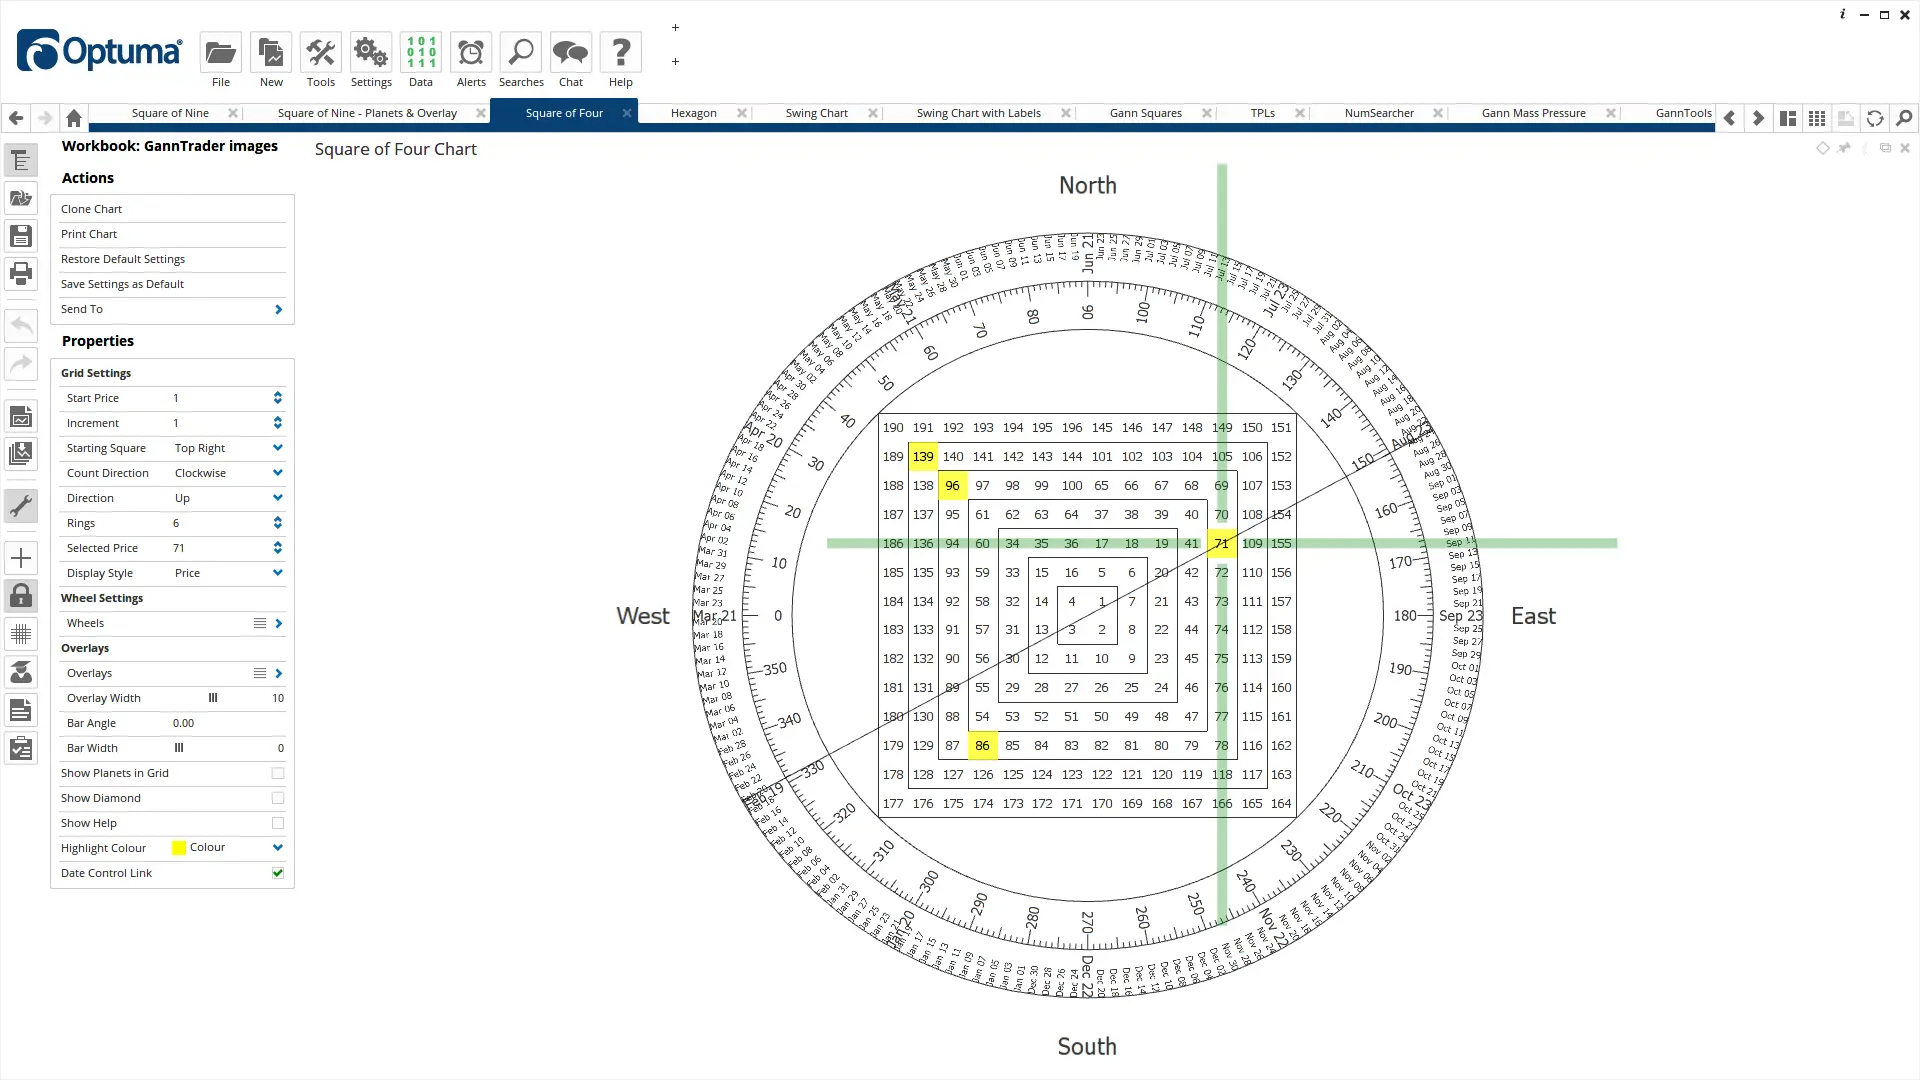
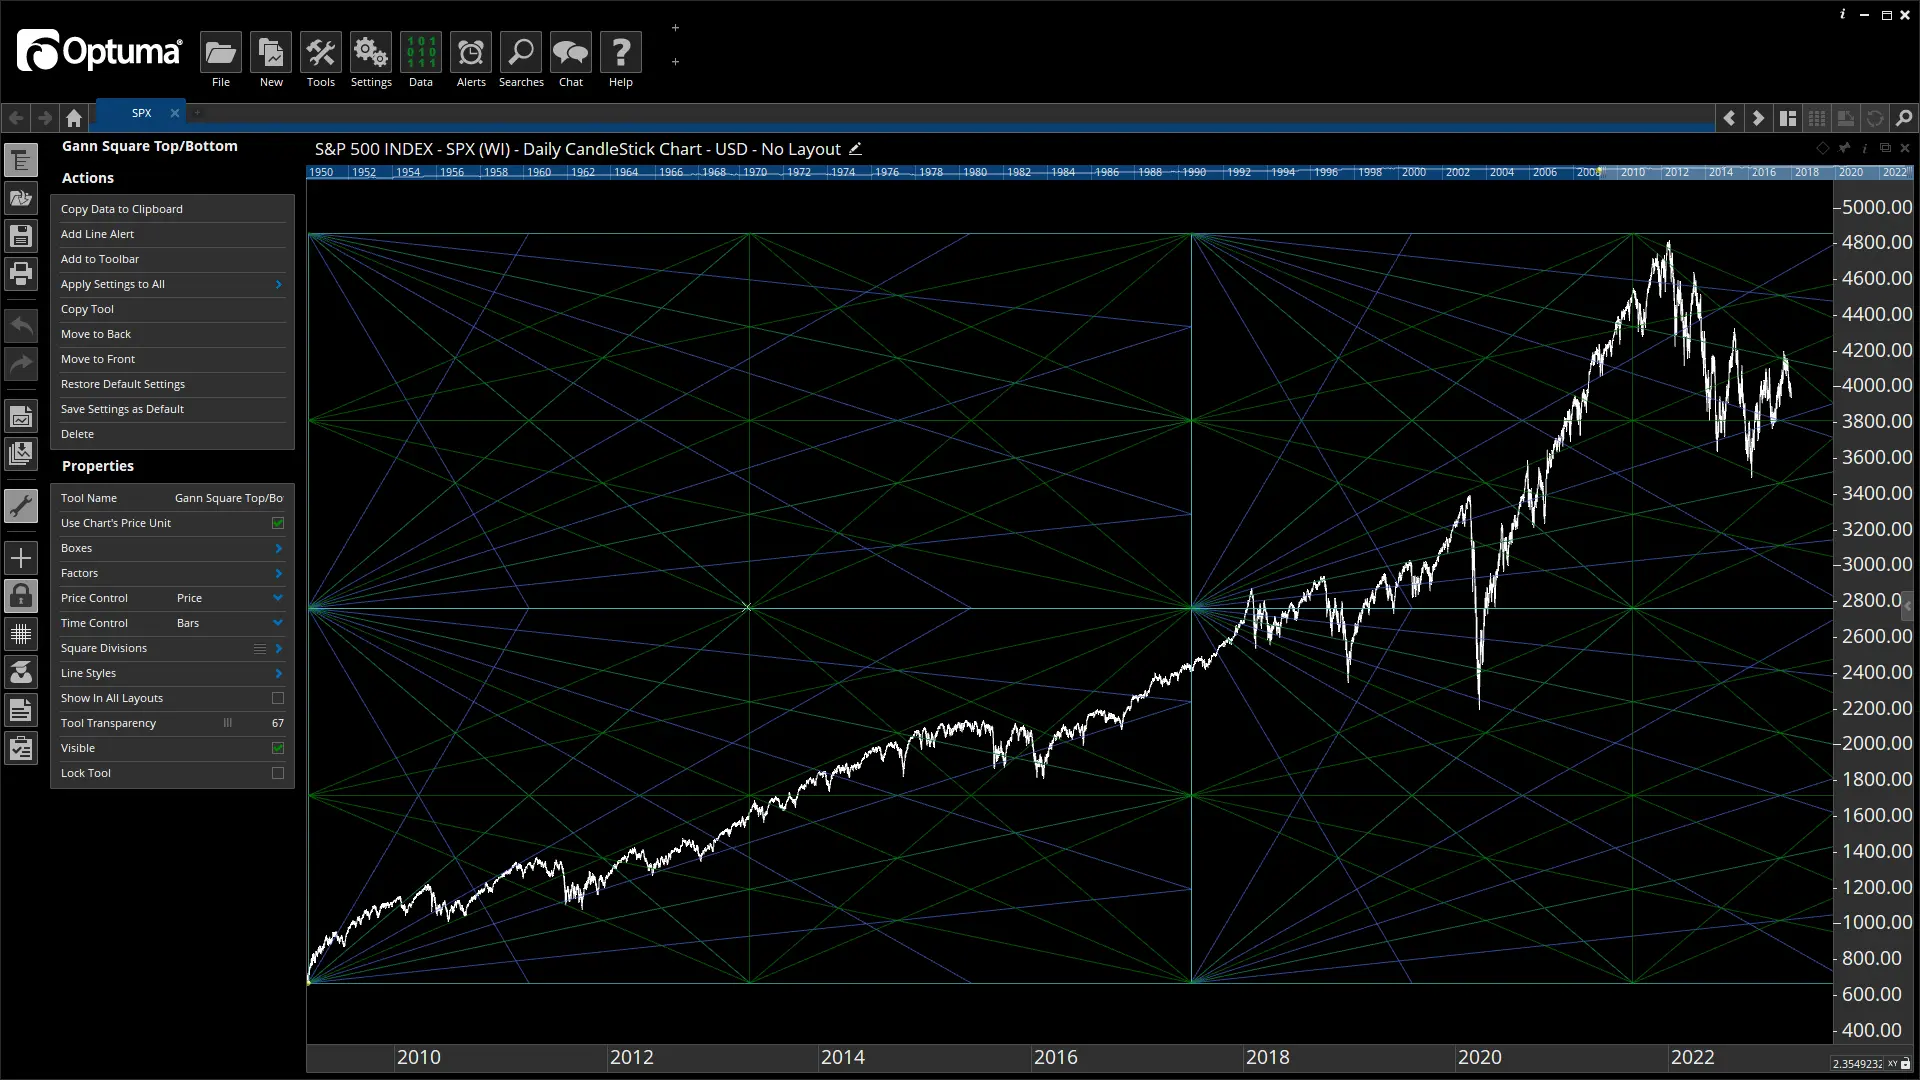
The Square of Four chart was used by W.D. Gann in identifying market turning points. GannTrader includes the Square of Four using the same graphical power as the Square of Nine chart.
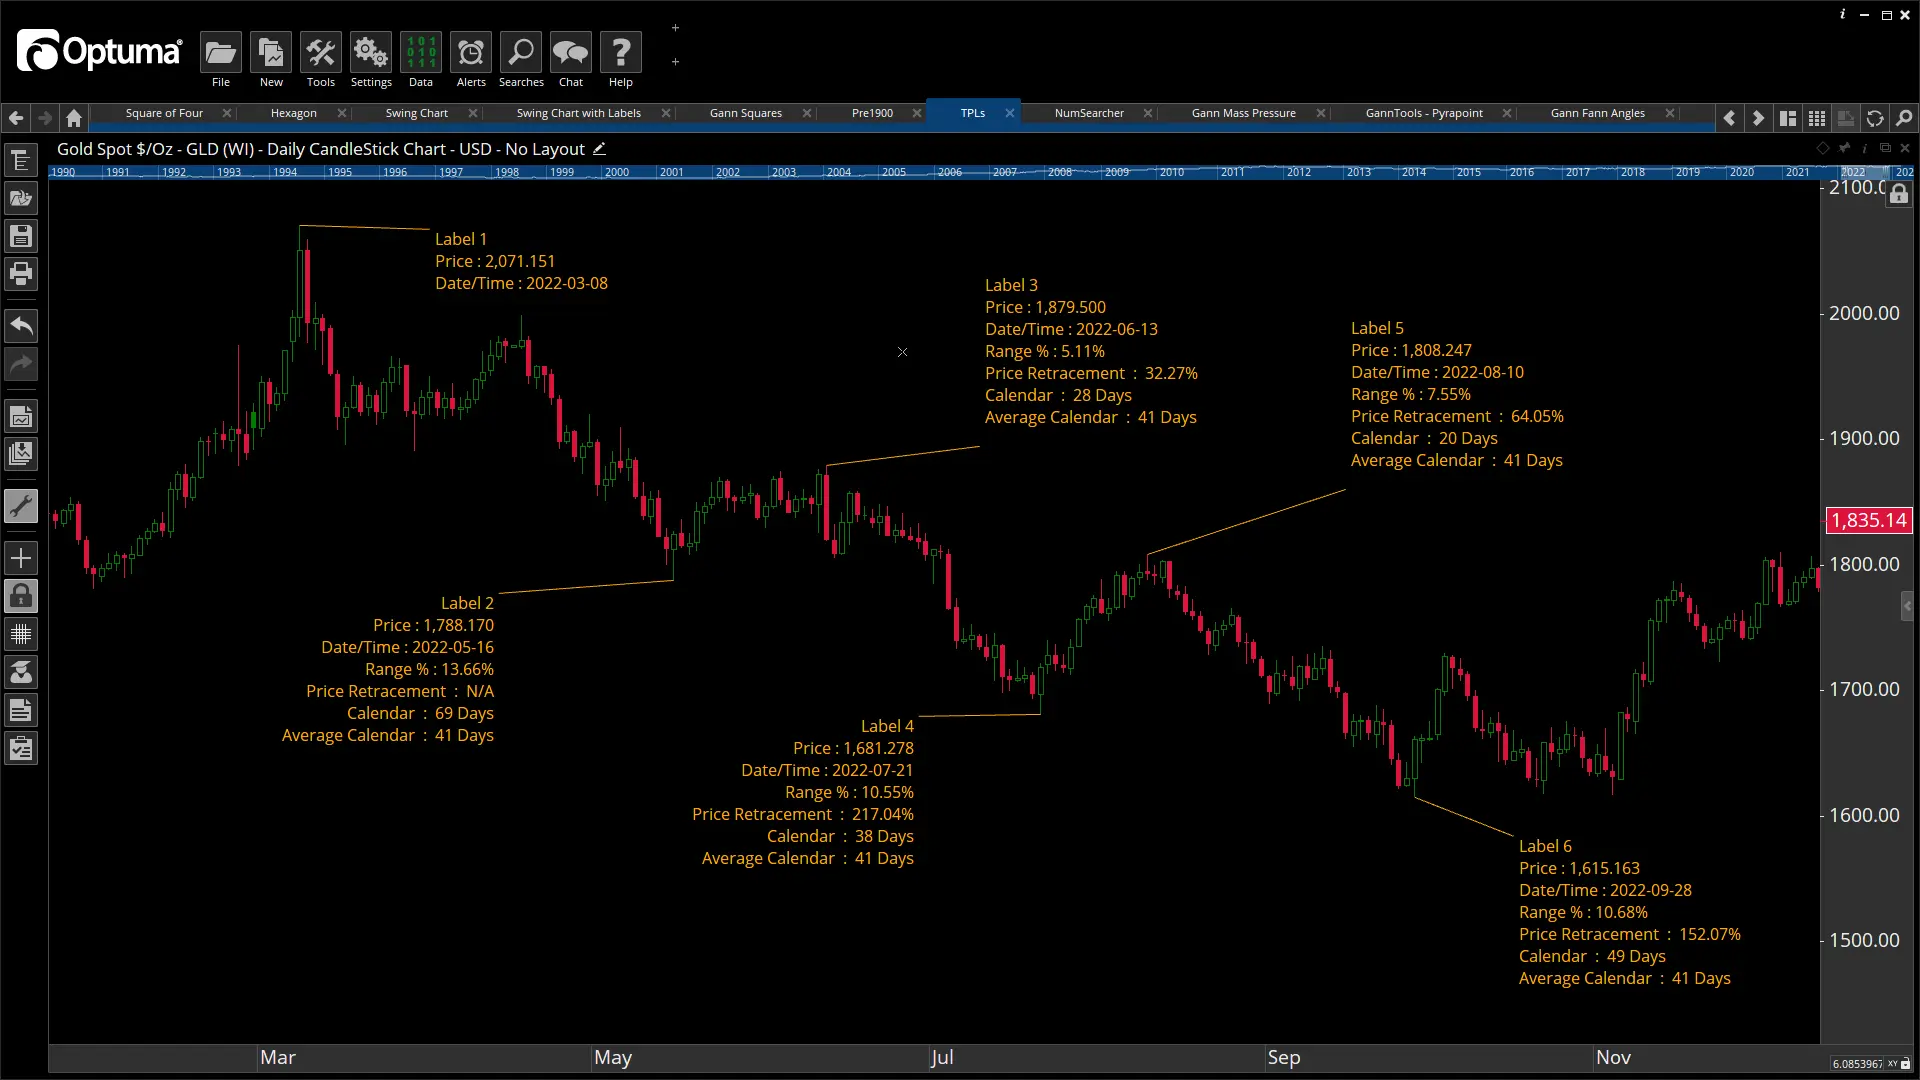
GannTrader’s time and price labels provide invaluable information between critical points in the market. You will get excellent insight into market cycles and time and price counts, forewarning you of important date and price levels.
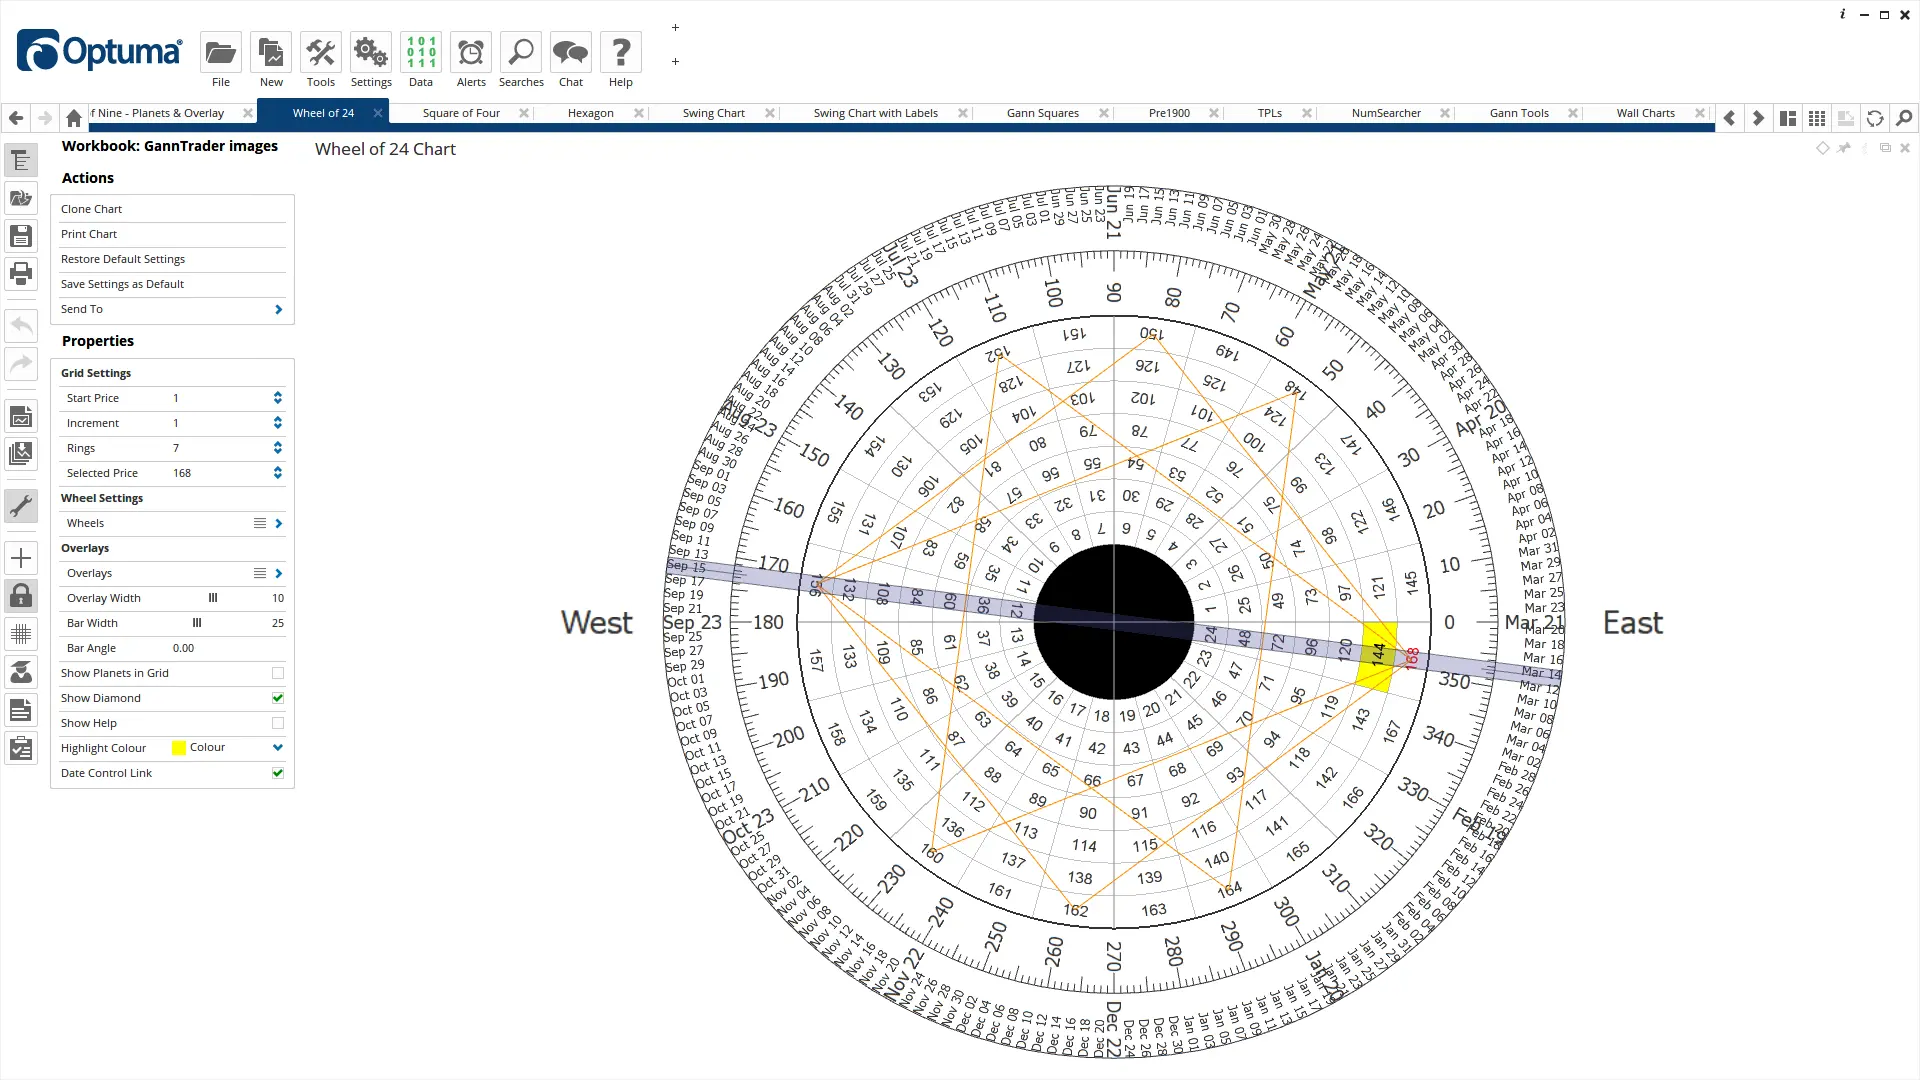
The wheel of 24 (also known as the Circle of 24) is one of the most mystical charts used by W.D. Gann. It’s referred to in Gann’s book “Tunnel Through the Air”. The Wheel of 24 is extensively used by intraday and end of day traders of Gann theory. GannTrader offers full user control over time settings, allowing for 24-hour and calendar year settings.
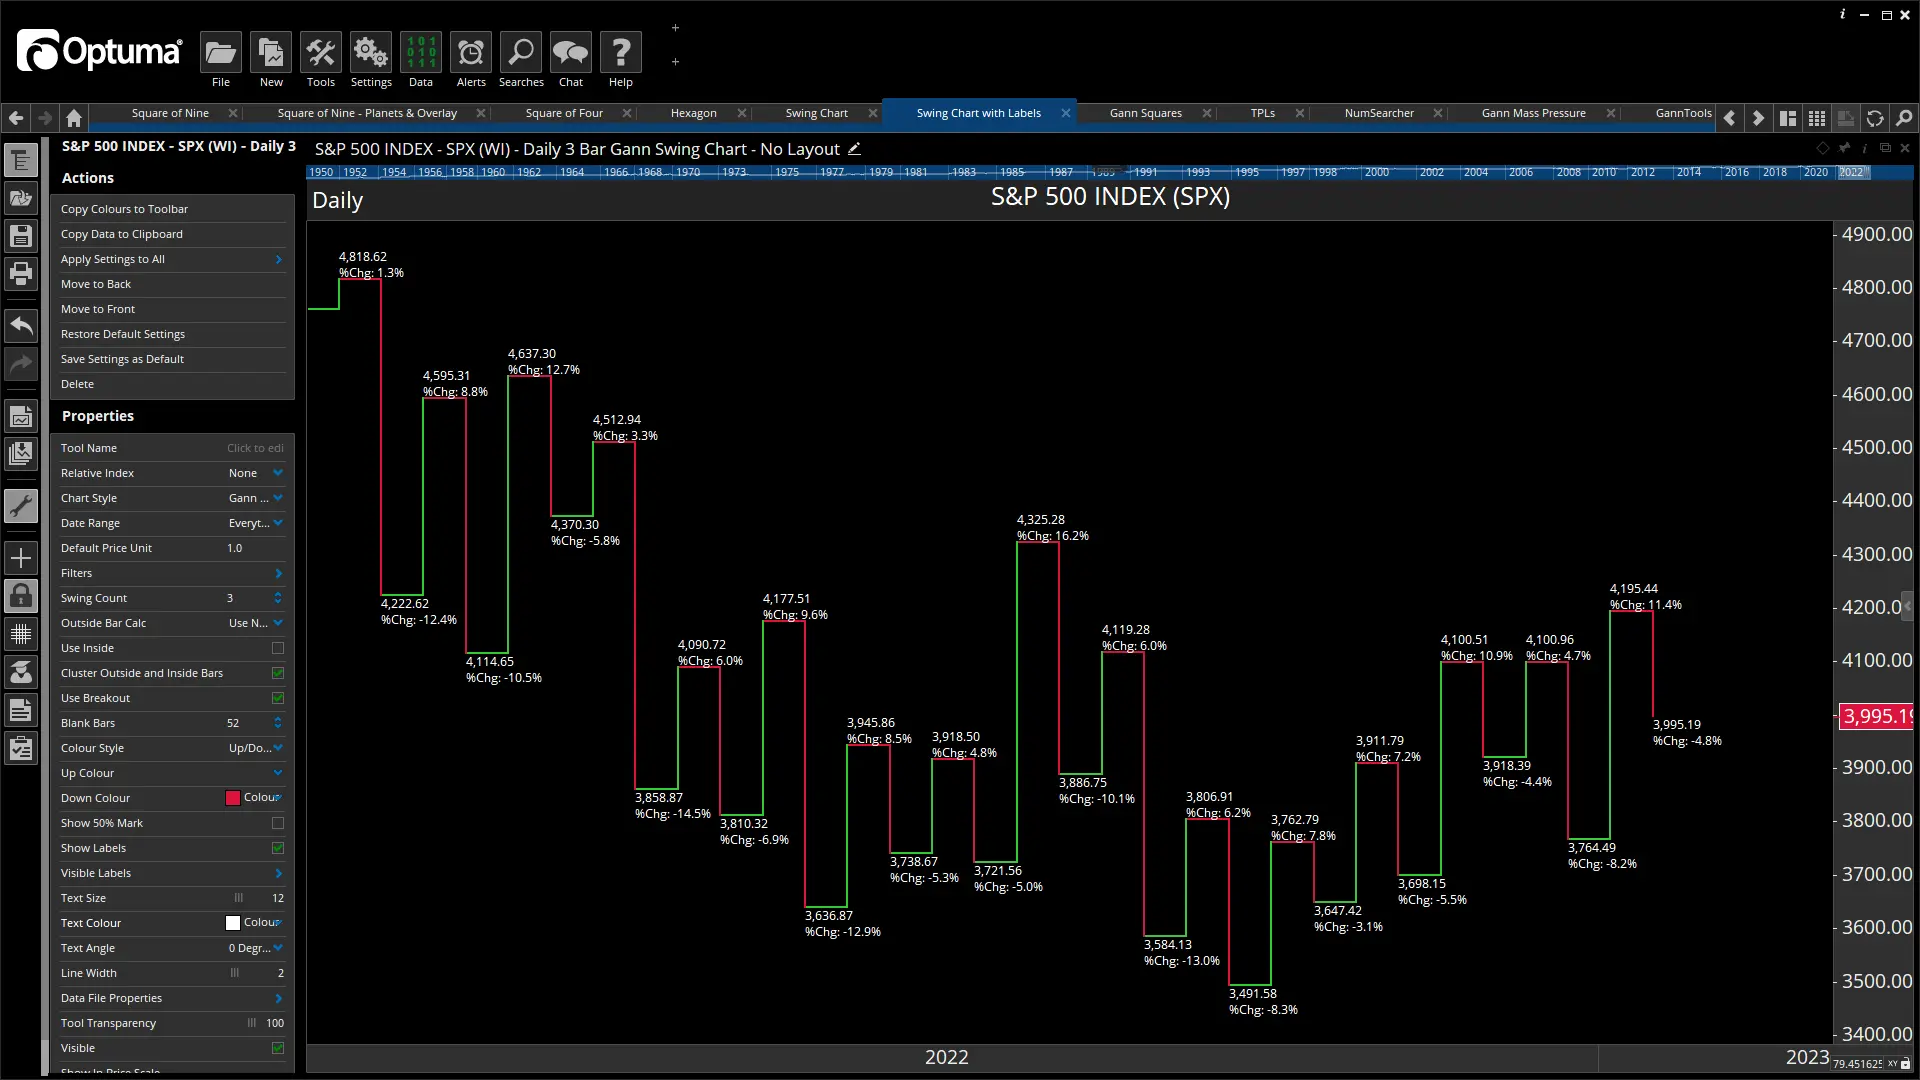
If you are a serious swing trader or someone trying to chart the finer art of Gann’s theories, you need GannTrader’s Swing Charts. GannTrader brings you the Gann Swing Chart, Point Swing Chart, and Percent Swing Chart. All Swing Charts can be completely customised for any time frame and any bar, point, or swing count. Optuma GannTrader puts the best tools of the trade into your hands.
The Square of 52, 90, and 144 were important natural squares W.D. Gann used in his trading. GannTrader brings Gann’s natural squares to life with an easy to apply overlay. You get the best user control allowing you to test any time count on your charts simply by typing the new time count into the properties.
GannTrader contains over 300 tools and indicators. It includes over 30 indicators dedicated to Gann analysis, time cycles, and advanced Fibonacci analysis.
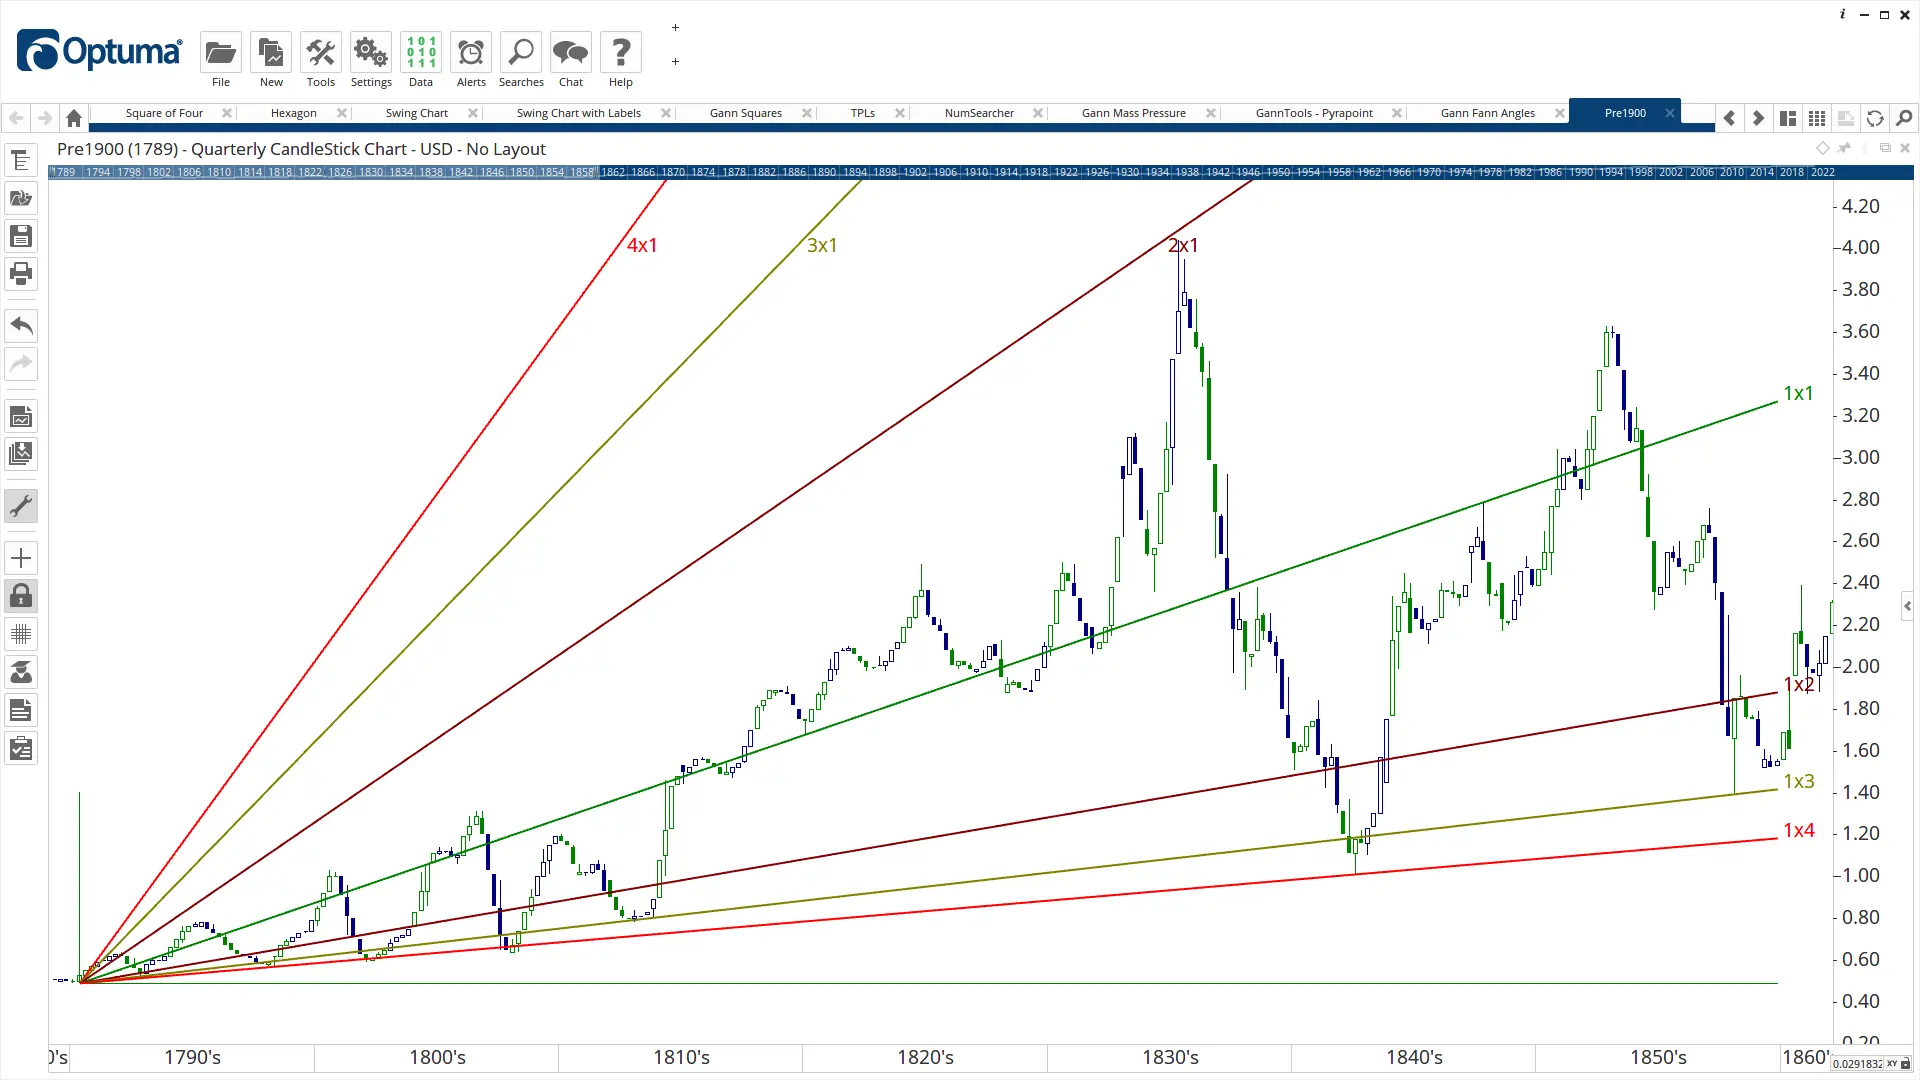
For any trader studying Gann timing cycles, the ability to study cycles over a period of more than 100 years is critical. GannTrader allows you to view market data going back to any time in history.
Gann Analysis is a form of technical analysis developed by the renowned trader and analyst, W.D. Gann. It involves the study of price patterns, time cycles, and geometric angles to forecast future price movements in financial markets.
At its core, Gann Analysis is based on the premise that price movements in markets are not random, but follow certain mathematical relationships and cyclical patterns. Gann believed that by identifying these patterns and understanding the geometric relationships between price and time, traders could gain an edge in predicting future price behavior.
Start your free trial today
View the markets with a clear lens Sign-up for your free trial of GannTrader
There is no need to know advanced mathematics to use our Gann & Astro tools. GannTrader does all the work for you. You will need a base understanding of Gann tools to implement them.